Game Design, Programming and running a one-man games business…

Making a game with real-world issues

My current project is Democracy 4, a game about politics, at a time when politics is…explosive to put it mildly. Right now we are in the middle of a global pandemic, there are riots going on over America, and countries all over the world have problems with fake news, extremism, extreme nationalism, gun violence and many other problems.

Democracy 4 obviously has to reflect the real world. Its a game about politics, so you cant pretend some issues do not exist because they are awkward. In fact, we are hopefully covering all political issues regardless how divisive they may be. Our game lets you outlaw homosexuality, or lets you allow gender-transition on demand. You can outlaw guns or let everyone have machine-guns. You can close all the airports, you can ban abortion, you can legalize prostitution, heroin and much more.

However, one of the topic in the game that I worry about right now, due to the current news cycle is this one:

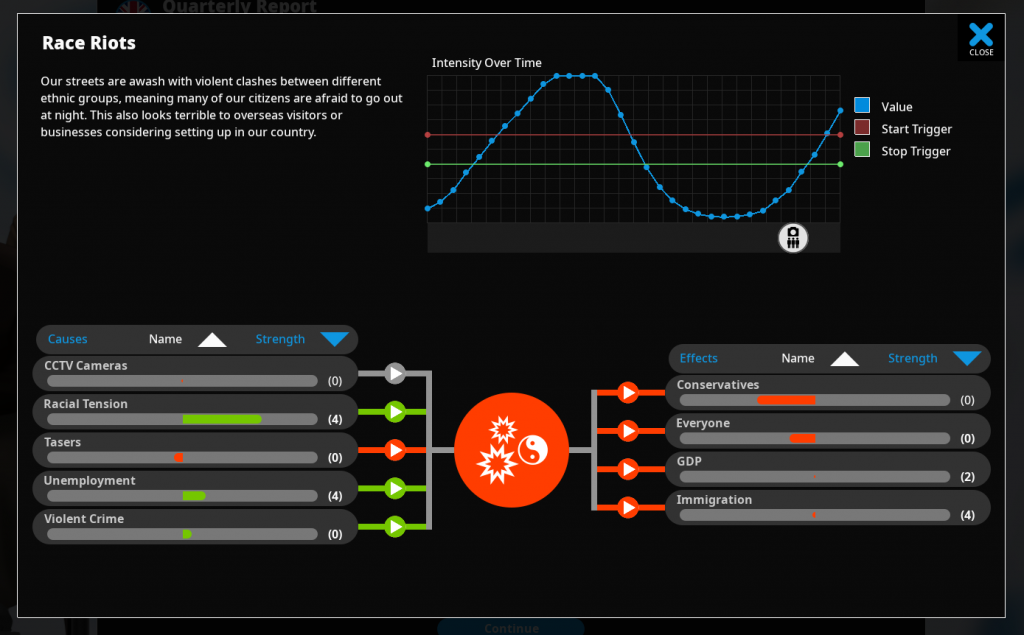
Race riots are not new to Democracy 4, they were in D3 too, but it feels weird to experience them in-game at the same time as they are actually happening. It reminds me just how *delicate* such topics are. What are the causes of race riots? Not just in the US, or where I live in the UK, but over the whole range of countries that we hope to cover. This is hard to nail down to a few equations in a spreadsheet… Currently the main causes of them are Racial Tension, Unemployment and Violent Crime. Racial Tension itself has a number of causes, but its linked to high levels of immigration. You can mitigate it with a high standard of living, race discrimination acts and a ‘stamp out racism’ week, which is a subtle bit of social engineering.

I’m trying really hard to make a politics game, not a POLITICAL game. There is no magical code buried inside democracy 4 that tries to arrange things to preach a subtle (or not subtle) ‘racism is bad’ message. As an individual, obviously I have my own views, but as I read more and more online political discussion I find it clear that preaching never convinces anybody of anything.

Democracy 4 is supposed to be a fairly accurate simulation. In it, I’m trying to guess what the causes of events are, and the outcomes and then just represent them. You can see that race riots hit GDP, and upset everyone. They should maybe arguably affect tourism too. They will also upset conservatives, who presumably worry that their houses may get looted in riots?

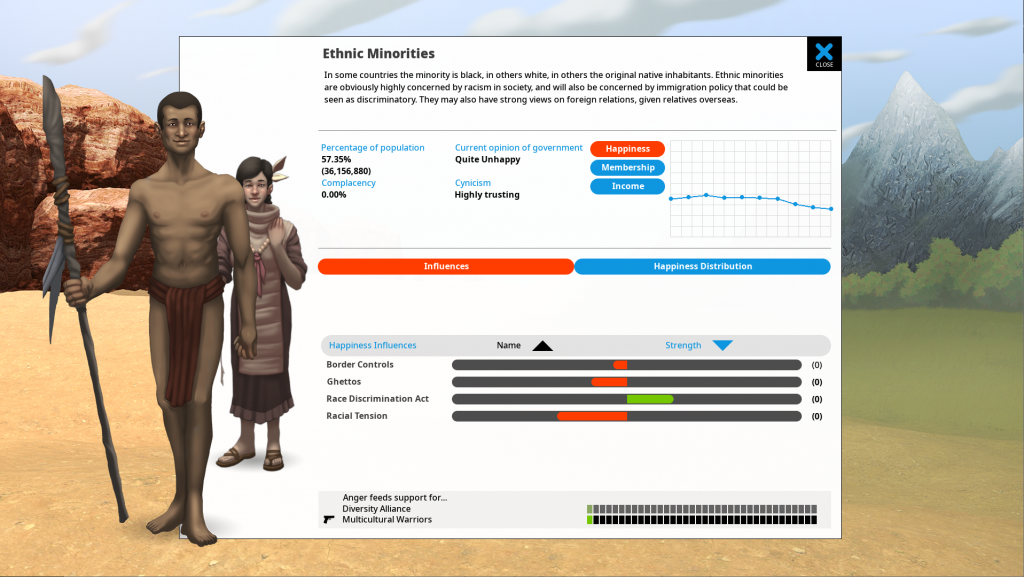
In general I am a believer that logic dictates treating humans fairly and equally, and that if we follow evidence, data and science, we tend to make good decisions. That includes following maths and economics. In Democracy 4, the player will learn that race riots severely affect their re-election chances, hurt the economy, and can be expensive in terms of the policies required to get them under control (rubber bullets, tear gas, water cannons etc). Someone who wants to *win* at Democracy 4 (constant election wins) will learn not to let any one political group get too angry, and that includes ethnic minorities. Its just simple good politics in the real world too.

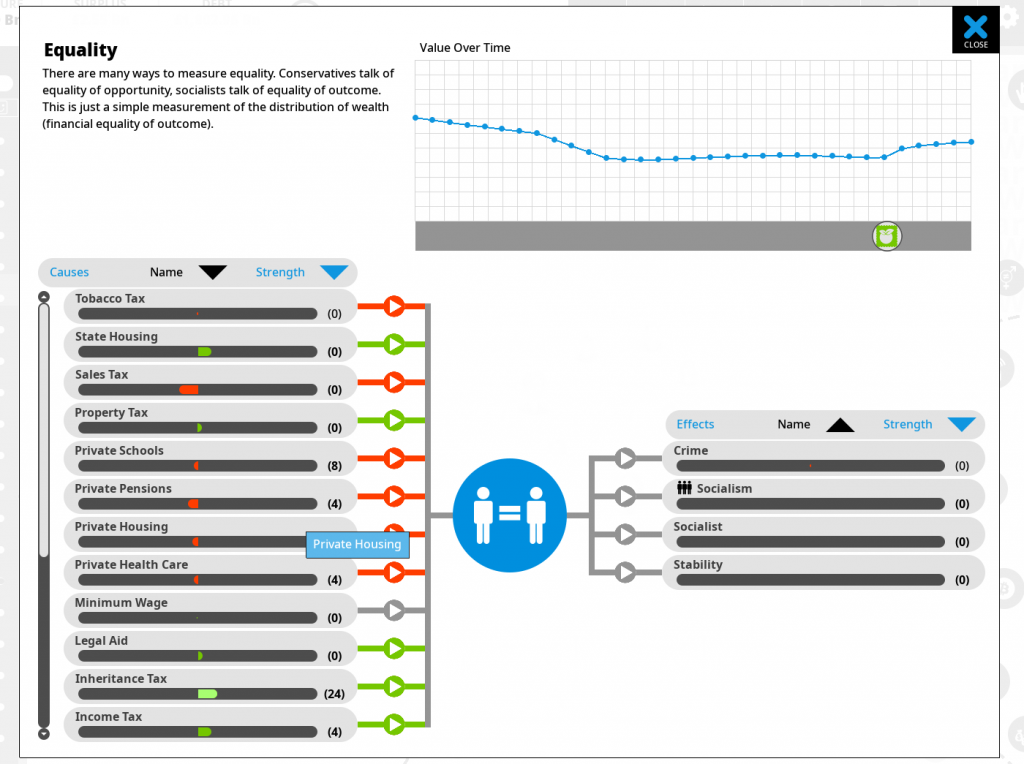
I think this is self evident to anybody who plays strategy games. There is always a consequence to every decision, and its good to think long term. If you are playing purely as a capitalist, you might see the need for some seemingly socialist policies just to prevent the social-breakdown and expensive consequences of vast inequality. Sure, you can pay people poverty wages, but if that means you need twice the police force to keep you safe as a result, is it really a net win?

I think its also a powerful argument in environmentalism. Sure, you can hate those hippies who hug trees and bang-on about carbon emissions, but have you SEEN the economic costs of extreme temperatures and food riots/wars/sea level rise that are the consequence of inaction? And for that matter have you seen how cheap electric cars are to run?

There is a persistent myth that Henry ford paid his workers a higher than normal salary so they could afford to buy the cars he made. Thats bullshit. I’ve read several books on ford. They were forced to hugely raise wages due to incredibly high staff turnover, but nevertheless its an interesting myth, that makes a lot of sense. Inequality has an ultimate cost, not just in security, but in terms of its negative impact on the economy.

This probably all sounds unfeeling and harsh, but I think of it as pragmatic. I believe in equal pay for women, equality for all races, and fair pay for workers *on principle*, but the most powerful argument is an argument of self interest, and the hardest argument is the ‘you should do the right thing’. There are a LOT of gun-toting, trump-supporting, right wing electric car owners now, because they finally made fast, sexy, affordable ones that people wanted, Appealing to people to buy them out of guilt never worked.

Nobody sums up this school of thought as well as quark from star trek deep space nine when he constructs an argument for ferengi women being allowed to wear clothes. He argues that if they wear clothes they will have pockets, and if they have pockets they will want to put stuff in them, so they will buy more stuff and stimulate the ferengi economy.

Its comedy, but also true.

I write all this to make a point about the style of Democracy 4 and its intentions. We cover a lot of dark, serious topics, and we do so without comment. There is no flashing symbol reminding you that RACIAL TENSION IS BAD. Adding it would be redundant, and change nobody’s opinion. Decisions in the game have consequences, and learning what those consequences are without further comment, or preaching is, I think, the best way to cover issues like this.

Real World Numbers in Democracy 4

I took some time over the last few days to go through some real world numbers on stuff (specifically government income and spending) and apply them to Democracy 4. The base country for the game, like with earlier versions, is the UK, and we then edit the data and scripts to better represent other countries as we add them.

Its been about five years since Democracy 3, and a lot has changed, so I wanted to make sure the starting scenario for the UK in Democracy 4 was vaguely realistic. We cannot ever be 100% realistic, because the model is obviously a simulation, and one that has to be fun, plus the starting date of the game is left deliberately ambiguous.

Also… we are not starting every country in the middle of a global pandemic, as that would seem super hard, and also fix the game in time in peoples minds. We DO have a virus outbreak event that is quite severe, but may have to introduce an even more severe global event at some point. Anyway…

I had to make some noticeable changes to the amount that certain things cost in the game. I was amusingly almost spot-on with the cost of the BBC, but the cost of some things like disability benefit, and the NHS in general (State Health Service) were almost comically low. Also. OMG national insurance (payroll tax) brings in a lot of money. I found a great source for this stuff here: https://www.ukpublicspending.co.uk/ Here are some charts:

In this chart the first thing that leaps out at me is ‘other’. 14% of spending! that is a big lump of money going somewhere nebulous. Here ius the breakdown:

Which just goes to show there is clearly a LOT of government spending on tiny, tiny things. Democracy 4 doesn’t really have a ‘fisheries’ department costing anything, or street lighting, but I guess eventually all those little thingsd add up.

The next big scary thing is that 6% of government spending on interest. This is us paying interest on our UK government debt. Some interesting charts:

My immediate response to such a chart is ‘yikes’. People often look at debt to GDP, but if government spending as a chunk of GDP is low (heavily capitalist), the debt/GDP can be low while interest/public spending is massively high. I would suggest that the best metric to look at is interest payments / public spending because this is the opportunity cost of debt, in other words, all the stuff you could be funding if you didn’t have to pay interest on debt. Right now we pay 6%, the same as the defence budget. Just for fun, here is the interest / GDP chart anyway…

Of course we live in times with stupidly low interest rates, although that varies massively by country.

Some economists say as a general rule that countries default (which is economically speaking REALLY BAD) when interest/GDP reaches 12%. If our current interest is 6%, then we need a simple doubling of the interest rate to hit that (assuming we balance the budget tomorrow and stop adding to the debt…)

Democracy 4 does not have an option to default on debt, mostly because that seems unthinkable for the USA, UK, Germany, France and other countries we will likely include. But maybe we should? Anyway….lets move on to look at where government income comes from…

I guess the big surprise here is how tiny the business taxes are. The Uk has fairly low taxes on companies (19%), but then we do not have the more generous and complex system of rebates and exclusions a lot of other countries have. Positech is a company, and we pay a simple 19% of our profits, with the only complication being if we get to claim video games tax relief on some portion of our expenses. We don’t qualify for anything else.

Indirect taxes are surprisingly large. I find the breakdown on that site to be pretty crap, so wen to the independent ‘office for budget responsibility’ and got this instead:

2019-20Percentage
Income tax1195.224.40%
of which: Pay as you earn163.220.40%
Self assessment32.84.10%
National insurance contributions140.617.57%
Value added tax134.616.82%
Corporation tax256.77.09%
of which: Onshore55.36.91%
Offshore1.40.17%
Petroleum revenue tax-0.6-0.07%
Fuel duties28.93.61%
Business rates31.63.95%
Council tax35.84.47%
VAT refunds14.51.81%
Capital gains tax91.12%
Inheritance tax5.60.70%
Stamp duty land tax313.41.67%
Stamp taxes on shares3.60.45%
Tobacco duties91.12%
Spirits duties3.60.45%
Wine duties4.40.55%
Beer and cider duties3.80.47%
Air passenger duty3.70.46%
Insurance premium tax6.10.76%
Climate change levy2.20.27%
Other HMRC taxes47.50.94%
Vehicle excise duties6.30.79%
Bank levy2.10.26%
Bank surcharge1.80.22%
Apprenticeship levy2.70.34%
Licence fee receipts3.30.41%
Environmental levies11.71.46%
EU ETS auction receipts0.70.09%
Scottish and Welsh taxes510.12%
Diverted profits tax0.30.04%
Soft drinks industry levy0.20.02%
Other taxes6.90.86%
National Accounts taxes746.293.26%
Less own resources contribution to EU-3.4-0.42%
Interest and dividends10.31.29%
Gross operating surplus43.75.46%
Other receipts3.20.40%
Current receipts800.1

…which goes to show some very interesting stuff. Mostly…UK tax revenue comes from Employees, Payroll tax, Sales tax and a bit of Corporation tax, fuel duty and business rates. The rest is just the remaining quarter.

So a diverted profits tax (basically the google tax) brings in virtually nothing (0.04%) compared to corporation tax as a whole at 7.09%. It looks like I should be tweaking some of the policies in Democracy 4 a lot.

For example right now UK payroll taxes in the game have a max input of only 25% of income tax, they should be 75%! Tobacco and wine taxes should bring in less than they do, and air passenger duty (airline tax) should bring in MUCH less. Also, maybe I need the UK to start off with a few of these policies already in place but super low. For example, we *do* have a pathetic diverted profits tax and a laughably low level of environmental levies…which is sort of a carbon tax. maybe these need to be implemented but at 1%?

Anyway, I guess the interesting point is that most of us voting citizens who claim to be aware of the world have ABSOLUTELY NO IDEA how much the government owes in debt, what it spends, and where it gets its money. In a pop quiz would you KNOW that (in order) the top 3 sources of UK government revenue is Income tax, National Insurance and VAT? Would you guess that the amount of money we raise each year in corporate taxes is only slightly higher than we pay out in debt interest? (56 vs 52 billion).

I find this stuff interesting, and despair at how badly our press does the job of educating us. We need more stats, more pie charts, more line charts, more numbers, and less pontificating about what an MP said on twitter today.

Maybe Democracy 4 can help focus peoples minds of the actual numbers behind politics?

Democracy 4: Variable slider costs…

An experiment for Democracy 4. The game now differentiates between <10%, <25% and larger policy slider moves with differing political capital amounts, indicated on the slider by red/green if achievable right now. Very happy with this :D. #smallerchangesareeasier

It makes sense that a 5% tweak to income tax (just an example) is easier to get agreed than a 50% rise or cut, and it also makes people stop and think about the various positions they can put sliders on some of the smaller and less dramatic policies. I think the green/red lines surrounding the chunks on the slider are self explanatory?

Visualising party membership & loyalty

Here is a screenshot from democracy 4 that I am not happy with, and I’ll explain why:

This is the parties screen in a 3-party game, and shows details of each party. The data presented is members, activist (real dedicated members who help get-out the vote, and then a scatter graph showing ‘approval of the party’ by every voter showing how close or far away they are from becoming members.

That third chart is the one I added today, and am thinking it kinda sucks. Its supposed to help the player understand fluctuations in party membership by giving them more than the ‘binary’ data of whether a voter is a member or not. This is because in the real world, people can be moderate members (they joined once, but don’t read the newsletter, and don’t get involved beyond just paying membership fees), right up to passionate members who become activists, hand out leaflets, attend rallies, and volunteer to help with fundraising and phone-banking.

The distinction is important, because you can have a party filled with extreme loyalists (unlikely to quit if you upset them a bit) or with moderate ‘soft membership’, where they are already disillusioned and the slightest policy shift will cause a collapse in membership.

BTW party membership matters because membership raise funds (used in campaigning), and members ALWAYS vote, regardless of usual turnout figures.

The problem is, I don’t think those charts make much sense to anybody who didn’t code the game… They shows party ‘approval’ on the Y axis (the X axis is random plotting), and approval depends on how close the voters opinions are to the parties position, and how close it has been over a period of time. This is complex and vague.

I think I might replace it with a single, taller graph that works differently and shows the range of approvals from zero (I HATE the government) to 1 (I LOVE the government), and plots everyone on that axis. We already have that (in a different axis) for the popularity analysis on the ‘everyone’ screen:

So I can do that but tilted anticlockwise 90 degrees. How does this help? Here is my magic idea:

I give each party a color (green, red blue) and I use those 3 colors to colorize the dots for each voter, showing how close they are to each parties platform. Voters who are members get colorised, others just get plotted in grey. I think this will work tons better, and it will make more sense… maybe. I’ll try it and post it tomorrow.

Ok…I couldnt stop and eat until i tried it. I think its better (needs some formatting tweaks)… thoughts…?