I’ve recently been on a bit of a mission to improve the speed at which my game Democracy 4 runs on the intel Iris Xe graphics chip. For some background: Democracy 4 uses my own engine, and its a 2D game that uses a lot of text and vector graphics. The Iris Xe graphics chip is common on a lot of low end laptops, and especially laptops not intended for gaming. Nonetheless, its a popular chip, and almost all of the complaints I get regarding performance (and TBH there are not many) come from people who are unlucky enough to have this chip. In many cases, recommending a driver update fixes it, but not all.
Recently a fancy high-end laptop I own basically bricked itself during a bungled windows 11 update. I was furious, but also determined to get something totally different, so got a cheap laptop made partly from recycled materials. By random luck, it has this exact graphics chipset, which made the task of optimising code for that chip way easier.
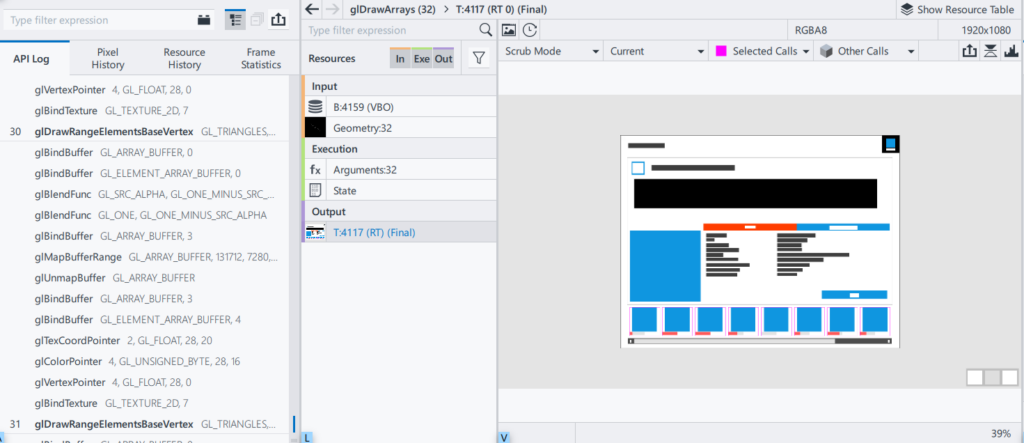
If you are a coder working on real-time graphics stuff like games, and you have never used a graphics profiler, you need to fix that right away. They are amazing things. You might be familiar with general case profilers like vtune, but you really cannot beat a profiler made by the hardware vendor for your graphics card or chip. In this case, its the intel graphics monitor, which launches separate apps to capture frame traces, and then analyze them.
I’m not going to go through all the technical details of using the intel tools suite, as thats specific to their hardware, and the exact method of launching these programs, and analyzing a frame of a game varies between intel, AMD and nvidia. They all provide programs that do basically the same thing, so I’ll talk about the bug I found in general terms, not tied to vendor or API, which I think is much more useful. The web is too full of hyper-specific code examples and too lacking in terms of general advice.
All frame capture programs let you look at a single frame of your game, and lists every single draw-call made in that frame, showing visually whats drawn, what parameters were passed, and how long it took. You are probably aware that the complexity of the shader (if any), the number of primitives and the number of pixels rendered all combine in some way to determine how much GPU time is being sent on a specific draw call. A single tiny triangle flat shaded is quick, a multi-render-target combined shader that fills the screen with 10,000 triangles is slow. We all know this.
The reason I’m writing this article is precisely because this was NOT the case, and discovering the cause therefore took a lot of time. More than 2 weeks in fact. I was following my familiar route of capturing a frame, noting that there were a bunch of draw calls I could collapse together, and doing this as I watched the frame rate climb. This was going fine until I basically hit a wall. I could not reduce the draw calls any more, and performance still sucked. Why?
Obviously my first conclusion was that the Iris Xe graphics chip REALLY sucks, and such is life. But I was doing 35-40 draw calls a frame. Thats nothing. The amount of overdraw was also low. Was it REALLY this bad? can it be that a modern laptop would struggle with just 40 draw calls a frame? Luckily there was a way to see if this was true. I could simply run other games and see what they did.
One of the games I tested was Shadowhand. I chose this because it uses a different engine (gamemaker). I didnt even code this game, but the beauty of graphics profilers is this: You do NOT NEED A DEBUG BUILD OR SOURCE CODE. You can use them on any game you like! So I did, and noticed Shadowhand sometimes had 600 draw calls at 60 frames a second. I was struggling with 35 draw calls at 40fps. What the hell?
One of the advanced mode options in the intel profiler is to split open every draw call so you see now only the draw calls, but every call to an opengl API that happens between them. This was very very helpful. I’m not an opengl coder, I prefer directx, and the opengl code is legacy stuff coded by someone else. I immediately expect bad code, and do a lot of reading up on opengl syntax and so on. Eventually, just staring at this of API calls makes me realize there is a ton of redundancy. Certain render states get set to a value, then reverted, then set again, then reverted, then a draw call is made. There seems to be a lot of unnecessary calls to setting various blend modes. Could this be it?
Initially I thought that some inefficiency was arising from a function that set a source blend state, and then a destination blend state as two different calls, when there was a perfectly good OpenGL API call that did both at once. I rewrote the code to do this, and was smug about having halved the number of blend mode state calls. This made things a bit faster, but not enough. Crucially, the number of totally redundant set and reset calls was still scattered all over the place.
To understand why this matters, you need to understand that most graphics APIs are buffered command lists. When you make a draw call, it just gets put into a list of stuff to be done, and if you make multiple draws without changing states, sometimes the card gets to make some super-clever optimisations and batch things better for you. This is ‘lazy’ rendering, and very common, and a very good idea. However, when you change certain render states, graphics APIs cannot do this. They effectively have to ‘flush’ the current list of draw calls, and everything has to sit and wait until they are finished before proceeding. This is ‘stalling’ the graphics pipeline, and you don’t want to do it unless you have to. You REALLY don’t want to constantly flip back and forth between render states.
Obviously I was doing exactly that. But how?
The answer is why I wrote this article, because its a general case piece of wisdom every coder should have. Its not even graphics related. Here is what happened:
I wrote some code ages ago that takes some data about a chunk of text, and processes all the data into indexed vertexes in a vertexbuffer full of vector-rendered crisp text. It makes a note of all this stuff but does not render anything. You can make multiple calls to this AddText() function, without caring if this is the first, last or middle bit of text in this window. The only caveat is to remember to call DrawText() before the window is done, so that text doesnt ‘spill through’ onto any later windows rendered above this one.
DrawText() goes through the existing list, and renders all that text in one huge efficient draw call. Clean, Fast, Optimised, Excellent code.
Thats how all my games work, even the directx ones, as its API-agnostic. However, there is a big, big problem in the actual implementation. The problem is this: The code DrawText() stores the current API render states, then sets them to be the ones needed for text rendering, then goes through the pending list of text, and does the draw call, then resets all those render states back how they were. Do you see the bug? I didn’t. Not for years!
The problem didn’t exist until I spotted the odd bug in my code where I had rendered text, but forgotten to call DrawText() at the end of a window, so you saw text spill over into a pop-up dialog box now and then. This was an easy fix though, as I could just go through every window where I render some text and add a DrawText() call to the end of that window draw function. I even wrote it as a DRAWTEXT macro to make it a bit easier. I spammed this macro all over my code, and all of my bugs disappeared. Life was good.
Have you spotted it now?
The redundant render state changes eventually clued-me-in. Stupidly, the code for DrawText() didn’t make the simple, obvious check of whether or not there was even anything in the queue of text at all. If I had spammed this call at the end of a dialog box that already had drawn all its text, or even had none at all, then the function still went through all the motions to draw some. It stored the current render states, set new ones, then did nothing…because the text queue was empty, then reset everything. And this happened LOTS of time each frame, creating a stupid number of stalls in the rendering pipeline in order to achieve NOTHING. It was fixed with a single line of code. (A simple .empty() check on a vector and some curly brackets… to return without doing anything).
Three things conspired to make finding this bug hard. First: I previously owned no hardware I could reproduce it on. Second: It was something that didn’t even show up when looking at each draw call, it manifested as making every draw call slower. Third: it was not a bad API call, or use of the wrong function, or a syntax error, but a conceptual code design fuck-up by me, My design of the text renderer was flawed, in a way that had zero side-effects apart from redundant API calls.
What can be learned?
Macros, and functions can be evil, because they hide a lot of sins. When we write an entire game as a massive long list of assembly instructions (do not do this) it becomes painfully obvious that we just typed a bazillion lines of code. When we hide code in a function, and then hide even the function call in a macro, we totally forget whats in there. I managed to hide a lot of sins inside this:
DRAWTEXT
Whereas what it really should have been though of was this
STORERENDERSTATESANDTHENSETTHEMTHENGOTHROUGHALISTTHENRESETEVERYTHINGBACK
This is an incredibly common problem that happens in large code bases, and is made way worse when you have a lot of developers. Coder A writes a fast, streamlined function that does X. Coder B finds that the function needs to do Y and Z as well, and expands upon it. Coder A knows its a fast function so he spams calls to it whenever he thinks he needs it, because its basically ‘free’ from a performance POV. Producer C then asks why the game is slow, and nobody knows.
As programmers, we are aware that some code is slow (saving a game state to disk) and some is fast (adding 2 variables together). What we forget is how fast or slow all those little functions we work on during development have become. I’ve only really worked on 3 massive games (Republic: The Revolution, an unshipped X Box game, and The Movies), but my memory of large codebases is that they all suffer from this problem. You are busy working on your bit of the code. Someone else coded some stuff you now need to interface with. They tell you that function Y does this, and they get back to their job, you get back to yours. They have no idea that you are calling function Y in a loop 30,000 times a frame. They KNOW its slow, why would anybody do that? But you don’t. Why would you? its someone else’s code.
Using code you are not familiar with is like using machinery you are not familiar with. Most safety engineers would say its dangerous to just point somebody at the new amazing LaserLathe3000 and tell them to get on with it, but this is the default way in which programmers communicate,
Have you EVER seen an API spec that lists the average time each function call will take? I haven’t. Not even any supporting documentation that says ‘This is slow btw’. We have got so used to infinite RAM and compute that nobody cares. We really SHOULD care about this stuff. At the moment we use code like people use energy. Your lightbulb uses 5 watts, your oven probably 3,000 watts. Do you think like that? Do you imagine turning on 600 light bulbs when you switch the oven on? (You should!).
Anyway, we need better documentation of what functions actually do, what their side effects are, what CPU time they use up, and when and how to use them. An API spec that just lists variable types and a single line of description is just not good enough. I got tripped up by code I wrote myself. Imagine how much of the API calls we make are doing horrendously inefficient redundant work that we just don’t know about. We really need to get better at this stuff.
Footnote: Amusingly, this change got me to 50 FPS. It really bugged me that it was still not 60 FPS> Hilariously I realised that just plugging my laptop in to a mains charger bumped it to 60. Damn intel and their stealth GPU-speed-throttling when on battery power. At least tell me when you do that!