Game Design, Programming and running a one-man games business…

Gratuitous Stats! (work in progress)

Right, so I’ve got totally distracted from my online-enabled metagame cleverness to improve the dowdy old stats screen for GSB, which we can all agree sucks right? Anyway, here is my current flimsy work in progress: (click to enlarge)

So an explanation of whats going on:

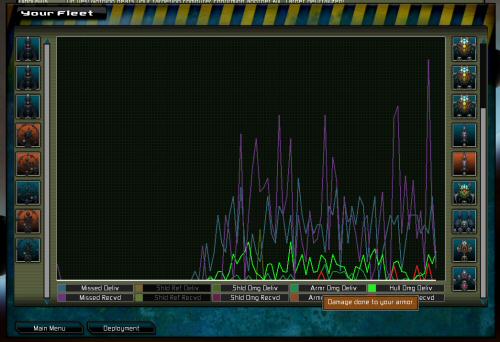
The graph shows  the damage done by every shot fired in the game, broken down into ten categories, which are missed, reflected by shields, damage to shields, damage to armor, hull damage, for both damage delivered (to the enemy) and received (from the enemy). The UI lets you toggle any of those categories on or off with a mouse click. Added to this, there are ship-pickers in two columns, with your fleet on the left, and the enemy on the right. By default all are enabled, but you can toggle each ship/squadron on or off. If you toggle them off, they get eliminated from the graph, which also auto-scales the Y axis to show things in better detail.

So if you want to know what effect your fighters have, you toggle off all the ships on the left except your fighters. if you then want to know what effect they had against enemy cruisers, you toggle off all the enemy ships except the cruisers. You can analyze it down to single pairings of ships if you like.

I’ve just realised I totally missed out damage ‘reflected’ by armor. I must add two new categories… bit of a squeeze now.

This isn’t the final screen, there is lots of minor UI tweaking to do, and it will have a more relevant title, plus I’d like to add options to view pie charts and other bits and pieces. Ideally I’d add little tags you could mouseover for events such as cruisers being destroyed, to put the charts in context. What I’m after is first impressions and feedback. Do you think that this is already an improvement on the old screen? I do, but I’ve spent 2 days on it so I’m biased :D.

My current plan is for this to just be in a patch, no add-ons needed. I am planning on a third new race expansion for the game at some point, because they seem popular and I love seeing new spaceships in the game :D.


14 thoughts on Gratuitous Stats! (work in progress)

  1. Looking nice! A few things popped into my head while and after reading: perhaps an option for two graphs, one on top for delivered, one below for received? Also informative would be an option to plot the graph as cumulative over time. Combine that with a third option to plot the graph in stacked form and I would bet those three toggles could be combined in all sorts of ways to bring out interesting information in the data. Some combos would be less useful than others, obviously, e.g. stacked graphs would be mostly useless when plotting delivered and received in the same graph instead of two separate graphs, but I can imagine some combos working really nicely e.g. separate delivered/received graphs with cumulative and stacked enabled.

  2. Another thought before I really have to get some work done this morning. :)

    Have you considered visualizing fleet shield/armour/hull _remaining_ over time?

  3. I am also a stat-aholic and these new graphs will be a much better choice than the screen i automatically skip at the moment. :D

  4. Looks great, but please give us all the stats in a CSV file too – it would be nice to take a look at all the data.

    I’m glad to hear about more races – please keep them coming!

  5. @Andrew – I was so tempted to post up a comment that just said “Export!” Thanks for doing so. :)

  6. Ha ! An other can full of worms has been opened !

    Looks very good, and the kind of stuff that I would I have tried to do myself too. I love the idea of being able to change the groups of ships that we are looking at.

    However, as Jeremy said in his second post, the first thing that I would have done, is looking as the evolution of the shields/armor/hull.

    The other is close to his last idea in the first post : Viewing the damage done at a given instant is interesting. But it is difficult to read. I would either try to display a “sliding average” to better show the trend, or probably better and easier to understand, display the cumulative damages. It is much easier to see what has been great in the end, and is still possible to see when things changed.

    Final suggestion : you are displaying damages that we do on the enemy. I do agree to with Jeremy’s first idea of being able to choose between received and given damages. Then should it be 2 different graphs ? I don’t know.

    Well. So basically it seems that Jeremy said it all !

  7. Oups, I am sorry… I hadn’t seen that the distinction between delivered and received was there already

  8. This will be the best single addition to the game yet. I’m more of a “casual” player — which means that seeing all of this in a graph let’s me play more strategically without staring at numbers for hours inferring behavior.

    I think for visual thinkers like me, this is actually a vast simplification of the game system! This isn’t just good improvement, I actually think it broadens your market (make sure you update the demo with this in it!)

    I also love that you are releasing this as a patch – it completely improves the core game without adding more “gameplay”. This is one of the blessings of buying from indie developers – you love your product and share it with your fans!

  9. It might be interesting to see all of these graphs in a “rate of change” or “summation” graph (derivitive/integral). It may only be interesting now, but I can only imagine the new races that may have a more significant effect on these views rather than the instataneous graph.

    (I’ve been reading your blog for months – my comments show how excited I am about this new graphing feature)

  10. I love it!

    My only request is to allow (in some manner I suppose) the player to see stats for each TYPE of ship, not just each individual ship. I think it would be helpful to see how a class, overall does, and by allowing each ship type to be selectable would be helpful.

    And this just thought: By default each class is toggled on or off by your screenshot of the ui, then add a drop down menu so you can select individual ships within that class (if you want to know how your flank did, you could check box all of those ships and see the stats, etc).

  11. verrrrrrrrrrrrrry niice ^^
    nd only 2 days of work ^^

    verry smooth

    and hmmmmmmmmm new race
    would be splendid

    i can’t wait ^^ for more great updates

  12. As far as I understand current system, it allows you to compare the different shooting outcomes of some ship group. Actually, that’s not the most useful feedback available. The crucial part of post-combat analysis is the ship-to-ship performance comparison – e. g. how much damage was delivered by Cruiser 1 compared to Cruiser 2, or what part of all damage inflicted by whole fleet was delivered by one ship\ship type\ group of ships.

    The most useful pie charts would be structured like that:

    Chart A:

    1) Whole circle is the complete amount of damage inflicted.

    2) Section 1: damage inflicted by selected group of ships

    3) Section 2: damage inflicted NOT by selected group of ships.

    4) There may be additional break-downs by damage types, e. g. pie-in-a-pie, additionally coloured. For simplicity, there could be 2 types left – damage inflicted and damage not inflicted (missed).

    Chart B:

    1) Whole circle is the complete amount of damage inflicted by selected group of ships.

    2) There are as many sections, as there are ships in selected group: thus you can directly compare their efficiency.

    Point 4 from Char A still applies.

Comments are currently closed.