I recently watched a 2 hour documentary on the ZX spectrum, which means little to people from the USA, but it was a really early computer here in the UK. I am so old I actually had the computer BEFORE that, which was the ZX81, just a year earlier. The ZX81 was laughable by modern standards, and I expect the keyboard I am using has more processing power. It had an amazing 1kb of RAM (yes kb, not MB), no storage, no color, no sound, and no monitor. You needed to tune your TV into it and use that as a black and white monitor. Its this (terrible) PC I used to learn BASIC programming on.
Anyway, one of the features of ZX81/Spectrum days was loading a game from an audio cassette, instead of the alternative, which is copying the source code (line by line) from a gaming magazine and entering the ENTIRE SOURCE CODE of the game if you wanted to play it. Don’t forget, no storage, so if your parents then wanted to watch TV and made you turn it off, you had to type the source code again tomorrow. I can now type very fast… but the documentary also reminded me of another horror of back then, which was the painfully slow process of loading a game.
These days games load…a bit quicker, but frankly not THAT much quicker, especially given the incredible speed of modern hard drives, and massively so when talking about SSDS. Everything is so fats now, from SSD to VRAM bandwidth, to the CPU. Surely games should be able to load almost instantly…and yet they do not. So today I thought I’d stare at some profiling views of loading a large battle in Ridiculous Space Battles to see if I am doing anything dumb…
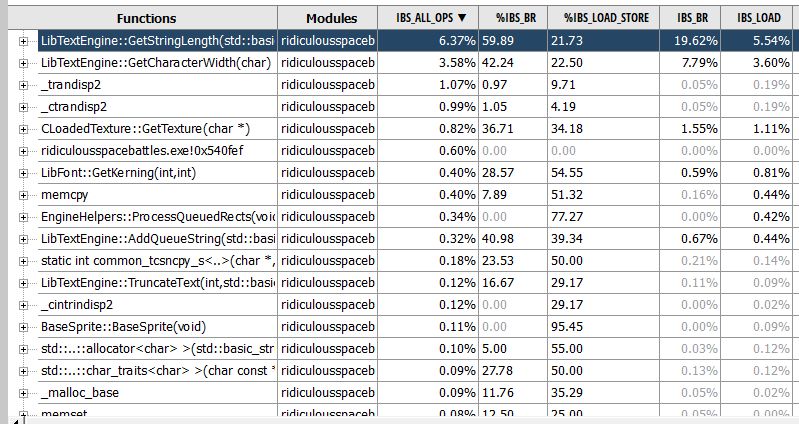
This is a screengrab from the AMD UProf profiler. My desktop PC has an AMD chip. I’ve started the game, gone to the ‘select mission’ screen, picked one, loaded the deployment screen, then clicked fight, let the game load, and then quit. These are the functions that seem to be taking up most of the time. Rather depressing to see my text engine at the top there… but its a red herring. This is code used to DISPLAY text, nothing to do with loading the actual game. So a better way to look at it is a flame graph:
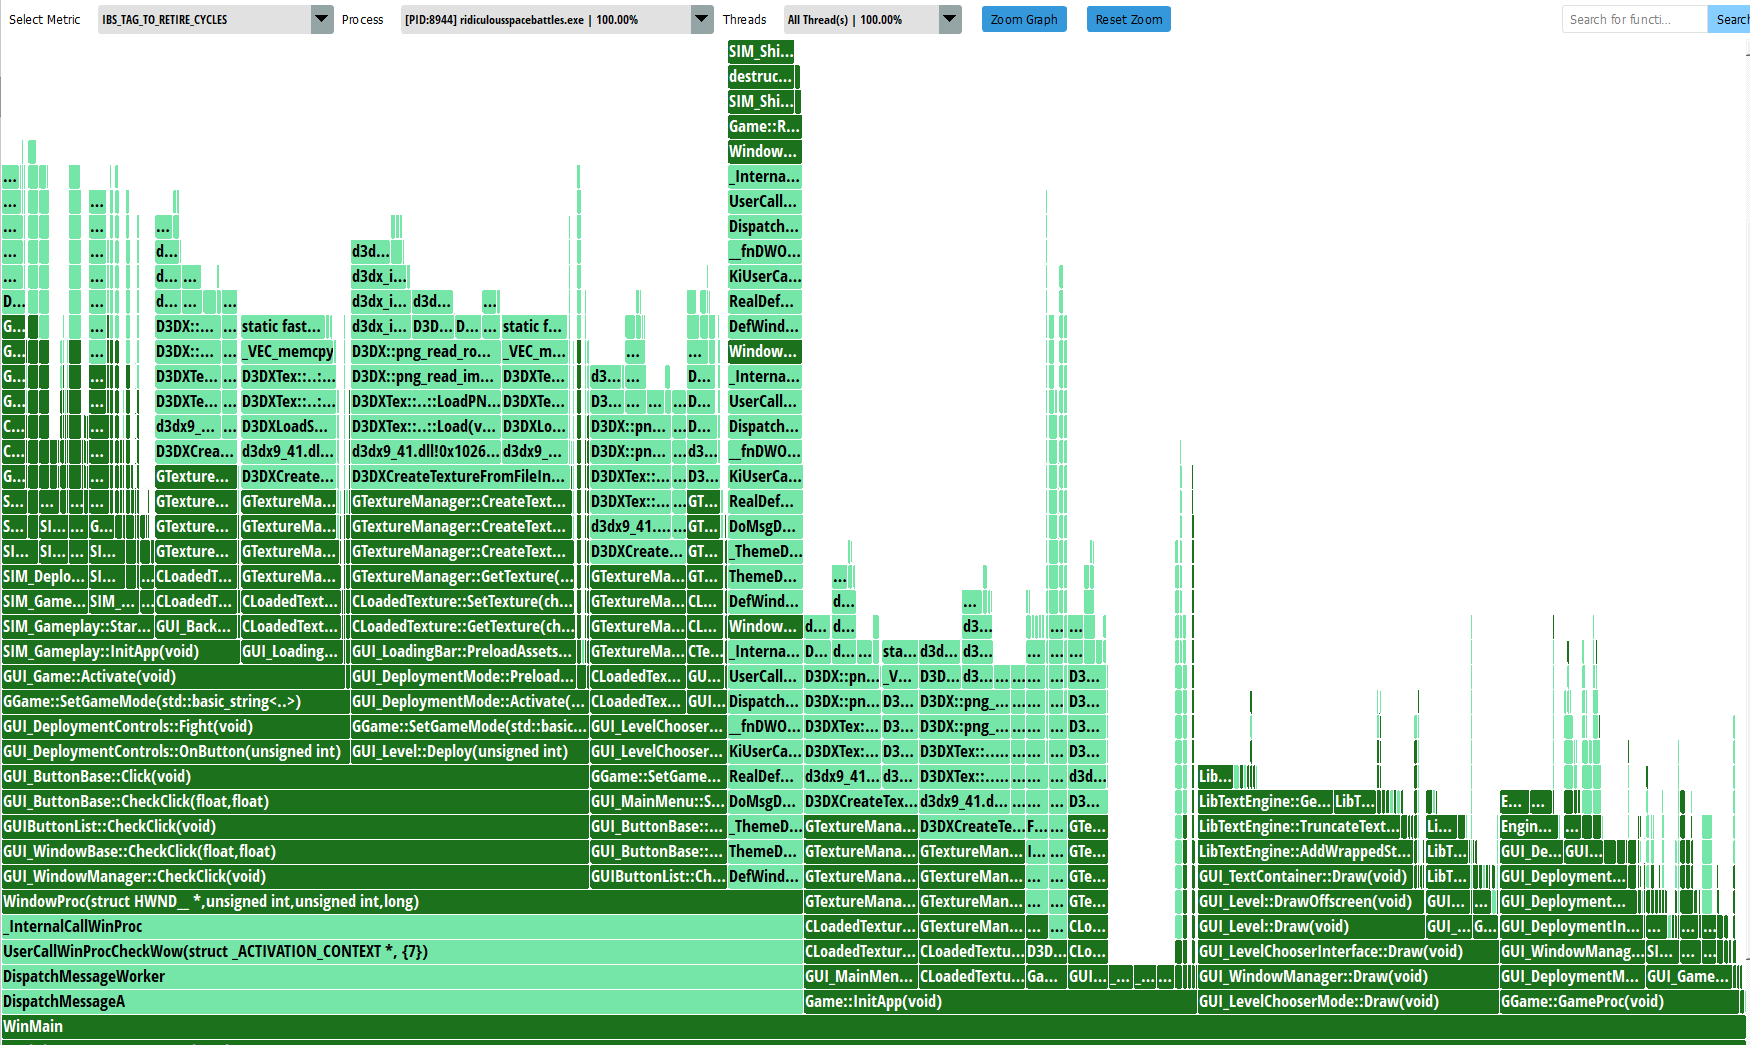
I love flame graphs. They are so good at presenting visual information about where all the time is going, and also seeing the call-stack depth at various points. This shows everything I did inside WinMain() which is the whole app, but I can focus in on the bit I care about right now which is actual mission loading…
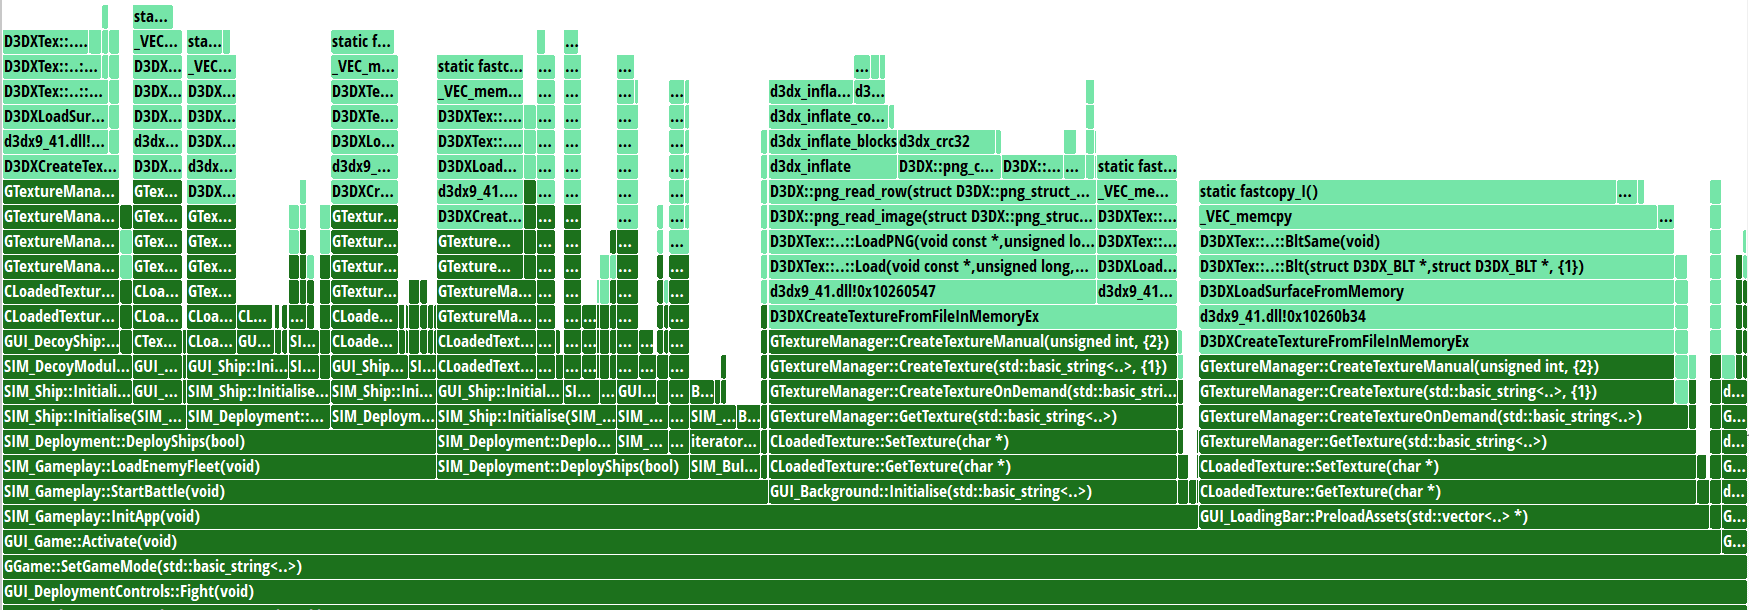
And now its at least relevant. It looks like there are basically 3 big things that happen during the ‘loading battle’ part of the game, and they are “Loading the ships” “Loading the background” “Preloading assets”. The GUI_LoadingBar code is given a big list of textures I know I’ll need in this battle, and it then loads them all in, periodically stopping to update a loading progress bar. Is there anything I can do here?
Well ultimately, although it takes a bit of a call stack to get there, it does look like almost all of the delay here is inside some direct9 functions that load in data. I am very aware of the fact that directx had some super slow functions back in directx9, in its ‘d3dx’ API, which I mostly replaced, but ultimately I am using some of that code still, specifically D3DXCreateTextureFromFileInMemoryEx…
Now I have already tried my best to make stuff fast, because I’ve made sure to first find the texture file (normally a DDS format, which is optimised for directx to use) on disk, and load the whole file into a single buffer in RAM before I even tell directx to do anything. Not only that, but I do have my own ‘pak’ file format, which crunches all of the data together and loads it in one go, which presumably is faster due to less windows O/S file system and antivirus accessing slowdowns. However I’m currently not using that system… so I’ll swap to it (its a 1.8GB pak file with all the graphics in) and see what difference it makes…
Wowzers. It makes almost no difference. I wont even bore you with the graph.
And at this point I start to question how accurate these timings are, so I stick some actual timers in the code. In a test run, the complete run of GUI_Game::Activate() takes 3,831ms and the background initialise is just 0.0099. This is nonsense! I switched from instruction based to time-based sampling in uprof. That doesn’t now give me a flame graph, but it does also flag up that the D3DX png reading code is taking a while. The only png of significance is the background graphic, which my timers suggest is insignificant, but I think this I because it was loaded in the previous screen. I deliberately free textures between screens, but its likely still in RAM… I’ll add timers to the code that loads that file.
Whoah that was cool. I can now put that into excel and pick the slowest loaders…
Loaded [data/gfx/\backgrounds\composite3.png] in 73.0598
Loaded [data/gfx/\scanlines.bmp] in 20.0463
Loaded [data/gfx/\planets\planet6s.dds] in 11.8662
Loaded [data/gfx/\ships\expanse\expanse_stormblade_frigate_damaged.dds] in 10.7132
Loaded [data/gfx/\ships\ascendency\g6battleship.dds] in 9.3622
Loaded [data/gfx/\ships\ascendency\g5frigate.dds] in 6.9765
OMGZ. So yup, that png file is super slow, and my bmp is super slow too. The obvious attempted fix is to convert that png to dds and see if it then loads faster. Its likely larger on disk, but requires virtually no CPU to process compared to png so here goes… That swaps a 2MB png for a 16MB (!!!!) dds file, but is it faster?
NO
Its 208ms compared with 73ms earlier. But frankly this is not an accurate test as some of this stuff may be cached. Also when I compare pngs of the same size, I’m noticing vast differences between how long they take to load:
Loaded [data/gfx/\backgrounds\composite11.png] in 113.9637
Loaded [data/gfx/\backgrounds\composite3.dds] in 208.7471
Loaded [data/gfx/\backgrounds\composite5.png] in 239.3122
So best to do a second run to check…
Loaded [data/gfx/\backgrounds\composite11.png] in 112.8554
Loaded [data/gfx/\backgrounds\composite3.dds] in 84.9467
Loaded [data/gfx/\backgrounds\composite5.png] in 108.4374
WAY too much variation here to be sure of whats going on. To try and be sure my RAM is not flooded with data I’d otherwise be loading, I’ll load Battlefield 2042 to use up some RAM then try again… Interestingly it only takes up 6GB. Trying again anyway…
Loaded [data/gfx/\backgrounds\composite11.png] in 114.0210
Loaded [data/gfx/\backgrounds\composite3.dds] in 85.6767
Loaded [data/gfx/\backgrounds\composite5.png] in 105.8643
Well that IS actually getting a bit more consistent. I’ll do a hard reboot…
Loaded [data/gfx/\backgrounds\composite11.png] in 104.3017
Loaded [data/gfx/\backgrounds\composite3.dds] in 207.8332
Loaded [data/gfx/\backgrounds\composite5.png] in 141.2645
Ok so NO, a hard reboot is the best test, and swapping to DDS files for the huge background graphics is a FAIL. These are 2048 x 2048 images. At least I know that. The total GUI_Game::Activate is 7,847ms. That png is only about 1-2% of this, and it makes me wonder if converting all the dds files to png would in fact be the best solution to speed up load times? The only other option would be to speed up DDS processing somehow. Having done some reading, it IS possible to use multithreading here, but it looks like my actual file-access part of the code is not vaguely the bottleneck, although I’ll split out my code from the directx code to check (and swap back to a png…)
Creating texture [data/gfx/\backgrounds\composite11.png]
PreLoad Code took 1.0205
D3DXCreateTextureFromFileInMemoryEx took 111.4467
PostLoad Code took 0.0001
Creating texture [data/gfx/\backgrounds\composite3.png]
PreLoad Code took 28.4150
D3DXCreateTextureFromFileInMemoryEx took 71.1481
PostLoad Code took 0.0001
Creating texture [data/gfx/\backgrounds\composite5.png]
PreLoad Code took 0.9654
D3DXCreateTextureFromFileInMemoryEx took 105.2158
PostLoad Code took 0.0001
Yeah…so its all the directx code that is the slowdown here. Grok suggests writing my own D3DXCreateTextureFromFileInMemoryEx function, which sounds possible but annoying.
Ok…mad though it sounds, I’ve done that. Lets try again!
Creating texture [data/gfx/\backgrounds\composite11.png]
PreLoad Code took 0.8327
D3DXCreateTextureFromFileInMemoryEx took 103.4365
PostLoad Code took 0.0001
Creating texture [data/gfx/\backgrounds\composite3.png]
PreLoad Code took 0.6053
D3DXCreateTextureFromFileInMemoryEx took 73.9393
PostLoad Code took 0.0002
Creating texture [data/gfx/\backgrounds\composite5.png]
PreLoad Code took 0.9069
D3DXCreateTextureFromFileInMemoryEx took 105.0180
PostLoad Code took 0.0001
Am I just wasting my life? at least I now have the source code to the DDS loader because it is MY code bwahahaha. So I can tryu and get line level profiling of this stuff now… I’ll try the visual studio CPU profiler:
Thanks Microsoft. But there may be more…
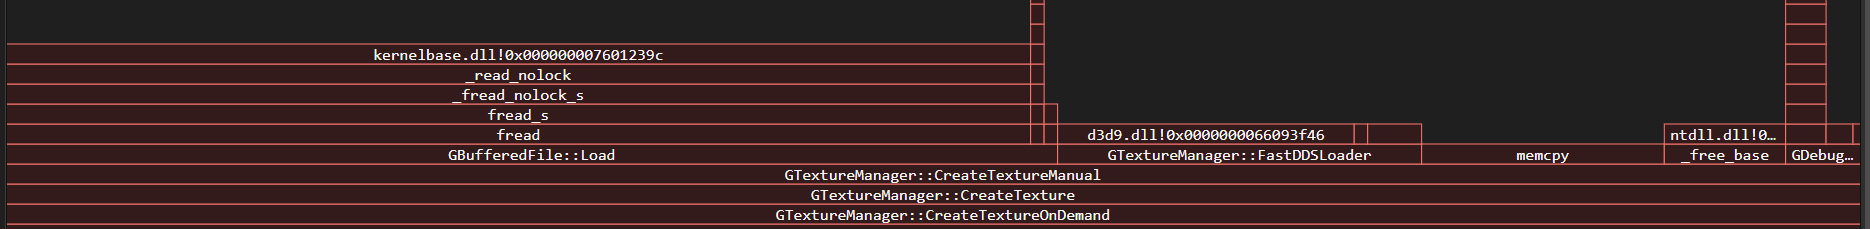
The Visual studio flame graph is saying that actually the raw reading from disk of the file IS a major component of all this, and so is a memcpy I do somewhere… Actually its inside the fast DDS loader, so the flame graph is confusing. The DDS loops doing memcpy calls for each line of data. This is very bad. With a big file, there will be 2,048 calls to memcpy just to read it in. Surely we can improve on that? and yet its clear thats what D3DXCreateTextureFromFileInMemoryEx is doing, as seen earlier. Hmmmm. And now people have come to visit and I have to stop work at this vital cliffhanger…