How psychopathic narcissist CEOs teamed up with money obsessed statisticians to trick gamers into thinking they are heroes
I recently watched a video about dark matter, which casually threw out a reference to a particular group of about 100 galaxies. I also recall seeing one of the first images from the James Webb space telescope, which covered a trivial, tiny piece of the night sky, and showed hundreds of galaxies. Galaxies are HUGE, and we can’t even see all of them. Even our tiny little solar system is huge, its hard to get your head around the distances involved in space. Mars is a LONG way away. Hell, I’m impressed with how big my country (the UK) is. I certainly would not casually walk from one end to the other. Even walking to the nearest shop seems a long way away.
I’ve sold over 3 million games. Even as I type this, it seems ridiculous. Its taken a long time to do it, about 20 years, but still its a pretty good record to have hit. In comparison to a lot of solo indie devs, it seems staggeringly high. But guess what… My business is irrelevant, a rounding error. Activision have no idea I exist, nor do they worry about me as a competitor, I’m sure Epic, or Microsoft and Apple also would consider me an infinitesimally small and irrelevant speck in the world of software.
The thing is, I am kind of fine with that. It is the absolute stunning height of arrogance to look at a world of billions of humans and assume that in some way you are one of the most important ones there. Absolute insanity. And yet… this seems to be an attitude that is getting more and more prevalent in society.
Video games have definitely played some part in this. Video games are totally different to movies, books, plays and operas. These are tales of other people. There is a Hero, or Heroine and they are special, and what they do shapes the story, and the story is basically THEIR story. They change the world, they save the world, they explore the world. And we read about it, and are impressed.
Video games let you actually be the hero, and then let you make decisions so that you really FEEL like the hero. This is a big difference. You are not witnessing great events, you are shaping them. Go you! You must be so awesome. Everyone else is just a ‘non-player-character’ (NPC), and their contribution to the universe is to help you on your epic quest. Their lives are irrelevant, as you can see from most MMOs now. They just stand there, waiting for an interaction with YOU the hero. You are the reason they stand in that marketplace all day hoping to find someone to give a quest to. Don’t worry, they wont give the quest to anybody else, only you. Everyone else is just filler. Its all about YOU.
And this would not be too bad a thing, as a little bit of escapist fun. I’ve played my fair share of video games and still manage to function in society (more or less). I think the problem is, that this is spilling out into society at large. Mostly because of our old nemesis: social media.
The idea that we all have a ‘feed’ and ‘stories’ that we must update on an hourly basis is laughable. Social media firms tell us we need to keep our timelines populated with interesting stuff so that our followers (yes we actually call them followers, a bit like disciples) can keep themselves informed about the minutiae of our lives. Its somehow EXTREMELY important that we keep our vast crowds of followers informed.
Twitter is currently in a furious legal dispute with Elon Musk over whether or not twitter lies about how many of its accounts are bots, and therefore likely fake. Some bots are to be expected… but more than 5%? Some say its vastly higher, and when you think about it, twitter has a huge vested interest in artificially inflating follower counts. Why on earth would you bother tweeting when you know you have 0 or 2 followers? Give a man 1,000 followers and they will feel special. Give them 10,000 followers and they will feel amazing.
Last time I looked I had about 10k followers, but I’m determined not to care. If they swept out fakes and it turns out I have 100 followers I’d just find it funny. I’m just a middle aged dude who makes computer games and plays guitar as a hobby. How do I have *any* followers? I’m not a famous philosopher or the prime minister. Why should anybody care about my life unless they actually know me? Do you REALLY want to know what meal I ate yesterday? or what I think of some new TV show? Why?
Luckily I am 52 or 53, can’t even remember now. This means I’m not in the peak target demographic for social media, where billion dollar businesses are desperate to give you body-shape dis-morphia, or a worry about skin blemishes, or a need to have urgent plastic surgery to make your nose 1% more attractive. We have a vast sprawling empire of businesses who exist based on a single premise: “You are unattractive”, and now we feed into the whole beauty industry with a new feeder-industry called social media. Instagram makes money by telling your your friends are more attractive than you. Then the skincare/cosmetics industry swoops in to make more money by claiming to fix it. Problem and solution wrapped up in one nice self-reinforcing money-machine.
The problem is… most of us are not actually going to be heroes. We will not save the day. Most of us will never be on the news. Most of us will never sign autographs, never trend on twitter, never be front page on reddit, and even if we do, its hardly world changing fame anyway. Its not all about us, all the time.
The reason I complain about this? because its come back full circle to video games and ruined them. There was a time, back in the distant rosy past where video games were cool and fun and the word ‘monetization’ had yet to be bastardized into existence. Back then, you just bought a game, and played it with friends. Some of the most fun gaming sessions of my life were playing as team in ‘return to castle wolfenstein’ when I worked at Elixir, or when I played against some serious hardcore gamers in the testing department at Lionhead for our lunchtime or after-work Call of Duty sessions.
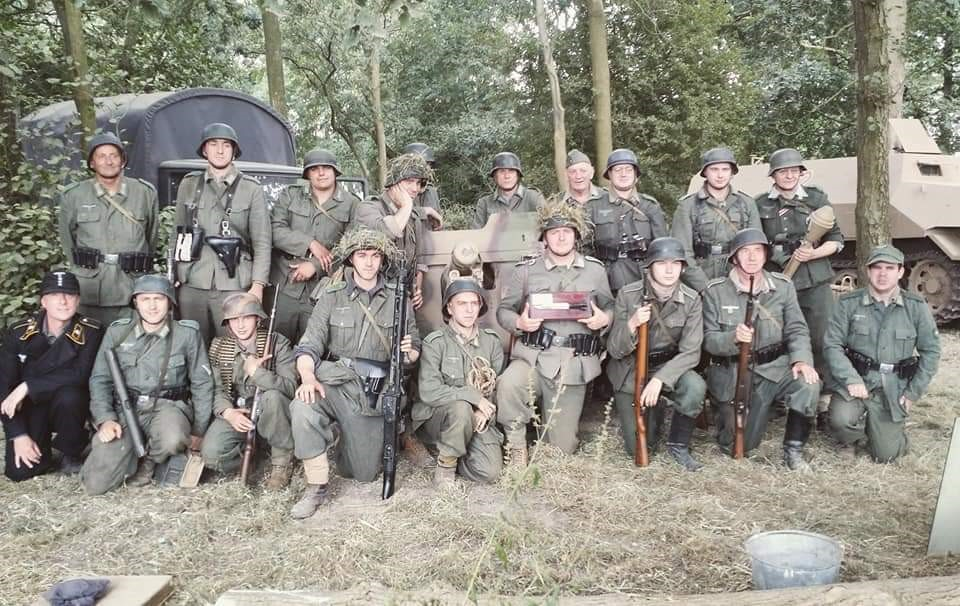
Both games were very much team games. The aim was to work as a team. Are we defending the bunker tonight? or assaulting it? Emphasis on WE, not I. We worked together, picking roles that supported each other, and what mattered was which team won. Nicely balanced, pretty immersive. I could tell who is on my team, because tonight we are th Germans, or because tonight we are the Americans. Storm that beach!
This is all gone now
The trouble with the ‘saving private ryan’ concept of an online team shooter is twofold. Firstly, everyone is working together as a team, which means YOU are no longer the most important person in the universe. Secondly, I cannot sell you hats. If you are all dressed as the Wehrmacht, or as American GIs… then where is the opportunity for micro-transactions? How the hell are we supposed to profit off gambling addictions in the 1% of rich players if you all dress the same? madness.
EA/DICE have now completed their absolute destruction of what used to be a very successful, very popular, very highly-regarded and profitable gaming series: Battlefield. The same was done by Activision by another competing but equally huge franchise: Call Of Duty. Both games totally and utterly destroyed, robbed of all immersion, with all sense of teamwork blown to pieces, all sense of being part of a big event, a small cog in a big wheel… totally ripped apart so the guys in suits (who have never played a video game in their whole life) can sell you more expensive hats.
Of course its didn’t end with hats. You and I might think selling $100 virtual hats to people with addiction issues is a good days work, but you aren’t thinking as cynically as the people who took over gaming do. You can only wear a single hat at a time you idiot! Lets sell you masks, shoes, gloves, and DIFFERENT COLOR GUNS. Yes, for every gun, lets have multiple skins, for each part of the gun. You want a gold plated muzzle on your sten gun? well boy do we have a good deal for you today, 50% off at just 5,000 credits. Not Dollars of course, if we priced stuff in dollars you might see how ridiculous it is. Its all priced in a currency that never sub-divides into round numbers of items…
Now in a sense, I don’t care if other people want to be ripped off for such trinkets. I’ve bought a single hat in Battlefield V, mostly as an experiment. I grinded through 1,300 hours to unlock absolutely everything else. Why should I care if other people prefer to just shovel money rather than… play the game… in order to ‘unlock’ all of that content that we apparently did not pay for when spending $60 on the game…
The reason I care is that I am now in a fancy dress ball instead of a war. Its true, not all uniforms would have been identical. Some soldiers got separated from their units in battle and got drafted into fill gaps in existing units. Some may have got hold of some decent winter scarves or boots from the body of some poor civilian. Some of the soldiers would be carrying different gear, or maybe uniforms would be tweaked depending if you were a radio-dude or a line infantryman… But no. Nothing exucse the ridiculous fancy dress car crash that is a modern online shooter.
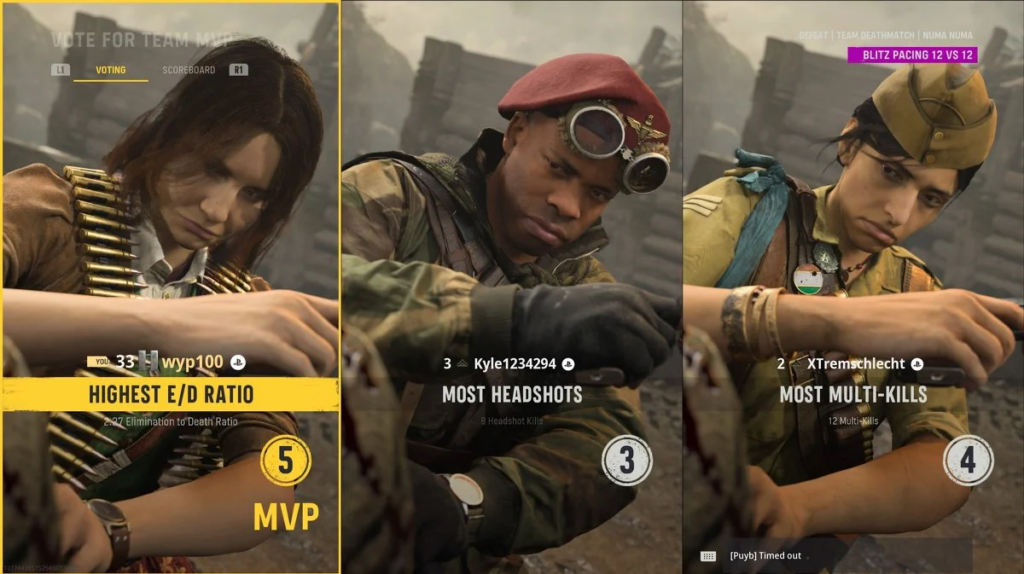
Do not be under ANY illusion that the people with any vague sense of artistic skill think that this is ok. NOBODY at a games company who actually designs characters is sat there looking at an American GI, Someone wearing a cowboy hat and sunglasses, someone with a clown mask on, and someone with luminous dreadlocks holding a pink bazooka, thinking ‘Yup, this is how I imagine world war 2 looked’. Anybody with any artistic sense at all knows its just a huge, embarrassing kowtowing to the gods of monetization.
And actually…thats bad enough, but its not even the worst thing. The worst thing is that for a sizeable chunk of modern game sessions… I’m not allowed to play. Not for any technical reason, but because the end of each round MUST contain a lot of mini cut-scenes where we show the victory animations of the clown, the dreadlocked bazooka kid, and the skateboarding panzergrenadier. Everyone HAS to have their moment, where the camera zooms into them in slow motion, where we all get to see in closeup that they spent extra money on that little silver pocketwatch strapped to their top hat. We are forced to spend as much time as we can bear looking at the amazing outfits of the other players, like we are fucking fashion correspondents at the paris fashion show. Modern shooters don’t have battlefields. They have catwalks.
Oh and those stupid victory poses, and the absolutely cringe inducing ‘sassy’ lines they speak? Yup, everyone hates those too, and they even silenced them after player outrage in Battlefield 2042, but they HAVE to be there, because after the hats, the masks, the dreadlocks, the skateboards, the gun skins, the victory poses… some idiot thought they could make even MORE money selling cringe-inducing victory quips.
Stop trying to pretend I am a hero, or more importantly I COULD be a hero if only I spent enough on microtransactions. I don’t care. I am fine with the concept of just enjoying an experience. I don’t need to be the center of attention. FFS probably half the world are introverts. Half of us (and we are clearly underrepresented in the boards of directors at games companies) are the kind of people who would DREAD everyone looking at what we are wearing and passing judgement.
Modern hero-shooters are a bastardization of decent games, driven by the unrelenting avarice of money obsessed suits who hate gaming, and by the narcissistic savior-complexes of the psychopaths who run games companies. I have advice for both:
Monetization guru: Please fuck off back to the stock market where you can play with numbers and be as cynical as you want all day without ruining peoples entertainment.
Game CEOs: Please get some fucking therapy. Not everyone wants to be you, not everyone is you, not everyone wants a thousand spotlights on them, not everyone daydreams about being on the cover of Newsweek. Blame that private school education that gave you an overinflated ego, and an inability to understand other people.
Yes. This is a rant, as all my blog posts turned into, but its a rant from the heart from a gamer who just despairs at how the industry he is a tiny tony (and happy to be so) part of has been ruined so dramatically.
Don’t forget to tweet and share this article. Its hugely important to my self worth to know that it is vastly popular*
*no it isn’t.