Democracy 4, (my latest game) is quite evidently a 2D game. There is an assumption by players and developers alike that 2D games always run fine, that even the oldest, crappest PC will run them, and that you only need to worry about optimisation when you do some hardcore 3D game with a lot of shaders and so forth.
Nothing could be further from the truth! There are a TON on 2D games that run like ass on any laptop not designed for gaming. I think there are a bunch of factors contributing to this phenomena:
- The growth in sandbox building/strategy games with huge sprawl and map sizes that can result in a lot of objects onscreen
- An emphasis on mobile-first computing has resulted in a lot of low-power low-spec but affordable CPUs/GPUs in laptops
- An emphasis on ‘retina’ display aspiration ahs meant high screen resolutions being paired with low-spec GPUs
- A lot of game developers starting with unity, and never being exposed to decent profilers, or ground-up programming, without understanding how video cards work
So my contention is that there is a bunch of people out there with mom or dads hand-me-down laptop that was bought for surfing the internet and using word, and is now being pressed into service reluctantly as a games machine. These laptops aren’t about to run Battlefield V any time soon, but they can run an optimized 2D game very well indeed… IF the developer pays attention.
Its also worth noting that markets like Africa/India/China er definitely good targets for future market growth, and a lot of these new gamers are not necessarily going to be rocking up to your game with a 2070 RTX video card…
I recently did a lot of optimizations on Democracy 4 and I’d like to talk through the basic principles and the difference it can make. Specifically how to double the frame rate (from 19 fps to 109fps) on a single screen. The laptop spec in question: Intel core i7 6500U @ 2.50GHZ CPU Intel HD Graphics 520 GPU, screen res 1920×1080. Here is the screen in question:

This is the ‘new policy’ screen in Democracy 4. TBH this screen looks a lot more complex to render than it actually is, because of some trickery I’d already done to get that lofty 19 fps. That background image that is all washed out and greyscaled is not actually rendered as a bunch of tiny icons and text. its drawn once, just as we transition to this screen, and saved in an offscreen buffer, so it can be blapped in one go as the non-interactive background to this screen. I use a shader to greyscale and lighten the original image so this is all done in a single call.
So here we are at 19 fps, but why! To answer that I needed to use the excellent (and free) intel GPA performance tools for intel GPUs. Its easy to use and install, and capture a trace of a specific frame. With the settings i chose, I end up with a screen like this:
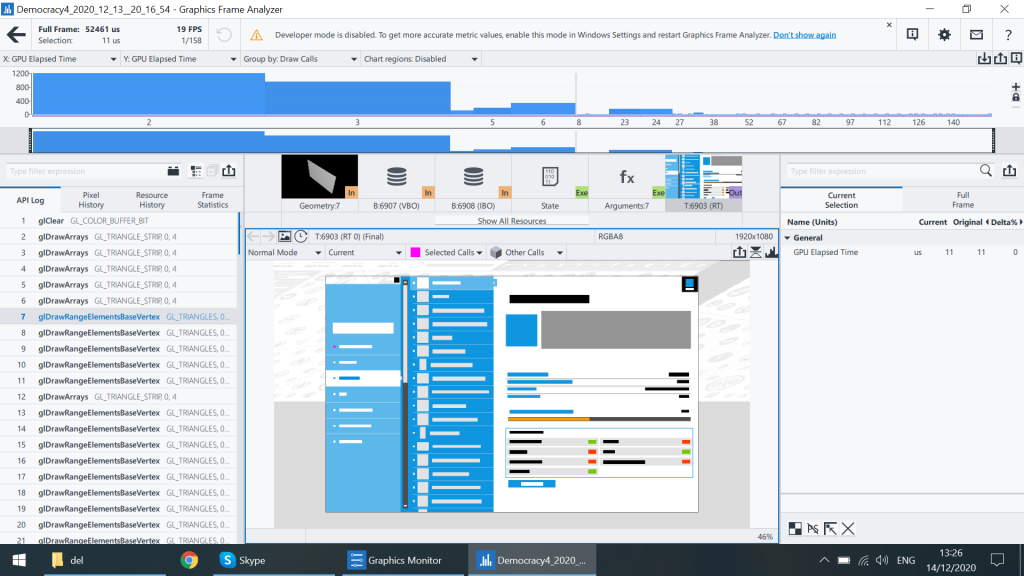
The top strip shows time in this frame, and how long each draw call took (X axis) and how many pixels were affected (y axis). A total of 158 draw calls happened in this frame, and thats why this puny GPU could only manage things at 19 fps.
Its worth setting up the frame analyzer so that you have GPU elapsed time on the X axis, otherwise all draw calls look as bad as each other, whereas in fact you can see that the first bunch of them took AGES. These are the ones where I draw that big full-screen background image, and where I fill the current dialog with the big white and blue background regions. It seems like even fill-rate can be limiting on this card.
By stepping through each draw call I can see the real problem. I am making a lot of really tiny changes in tiny draw calls rendering hardly anything. Here is draw call 77:
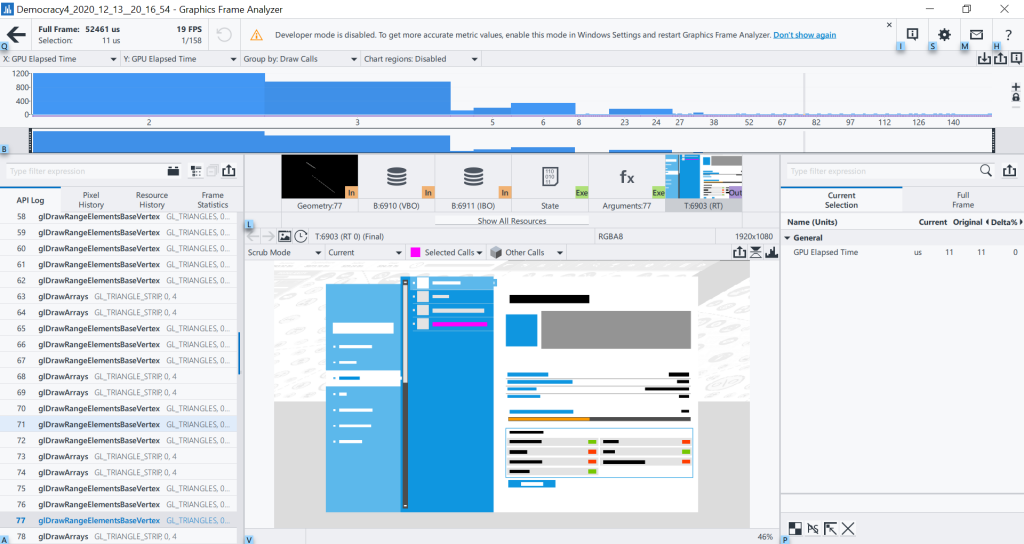
This draw call is basically just the text in that strip in the middle of the screen (highlighted in purple). Now this is not as inefficient as a lot of early-years gamdev methods, because the text has actually been pre-rendered and cached, so that entire string is rendered in a single strip, not character-by-character, but even so its a single draw call, as is each icon, each little circular indicator, and each horizontal line under each strip.
So one of these strips is actually requiring 4 draw calls. And we have 18 of them on the screen. So 72 draw calls. Can we fix this?
Actually yes, very easily. I actually do have code in the game that should handle this automatically, by batching various calls, but it can become problematic as limits in buffers can be reached, and textures can be swapped, requiring an early ‘flush’ of such batches, which if they happen in the wrong order, can mean missing text or icons. As such, the simplest and easiest approach is to change the code that roughly goes like this:
for each strip
  Draw horzizontal line
  Draw Icon
  Draw little circle icon
  Draw Text
…to something more like this…
for each strip
  Batch horizontal line
Draw all lines
for each strip
 Batch Icon
 Batch little circle icon
Draw all Icons
for each strip
 Batch text
Draw All Text
Which on the face of it looks like more hassle. isn’t it bad to iterate through the list of strips 3 times instead of 1? Well kinda…but I’m GPU limited here. the CPU has time to do that stuff, and actually there is likely NO TIME LOST at all, because of CPU/GPU concurrency. Something people forget is you are coding 2 chips at once, the CPU and the GPU. Its very common for one to just be waiting for the other. While the GPU is doing ‘Draw All Lines’ my CPU can keep busy by building up the next batched draw call. Concurrency is great!
I guess we nee to take a moment here to ask WHY does this work? Basically video cards are designed to do things in parallel, and at scale. A GPU has a LOT of settings for each time it does anything, different render states different blend modes, all the various fancy shader stuff, culling, z-buffer and render target settings etc. Think of it as a MASSIVE checklist of settings that the GPU has to consider before it does ANYTHING.
When the GPU has finished its checklist, it can then pump a bunch of data through its system. Ideally everything has been set up with huge great buckets of vertices and texels, and they can all blast through the GPU like a firehose of rendered pixels. GPUs are happiest when they are rendering a huge ton of things, all with the same settings. The last thing it wants is to have to turn off the firehose, and go through the darned checklist again…
But with a new draw call, thats pretty much what you do. Unless you are doing fancy multi-texturing, every time you switch from rendering from texture A to texture B, or change the render states in some other way, then you are ‘stalling’ the video card and asking it to reset. Now a GPU is super-quick, but if you do this 150 times per frame… you need to have a GPU that can handle this 900 times a second to get the coveted 60fps. Thats without the actual rendering, flipping or anything else…
So the less resetting and stalling of the card the better, which means BATCH BABY BATCH!
Now with the re-jig and those strips being done with the new algorithm (plus a few other tweaks), the GPA analysis looks like this:
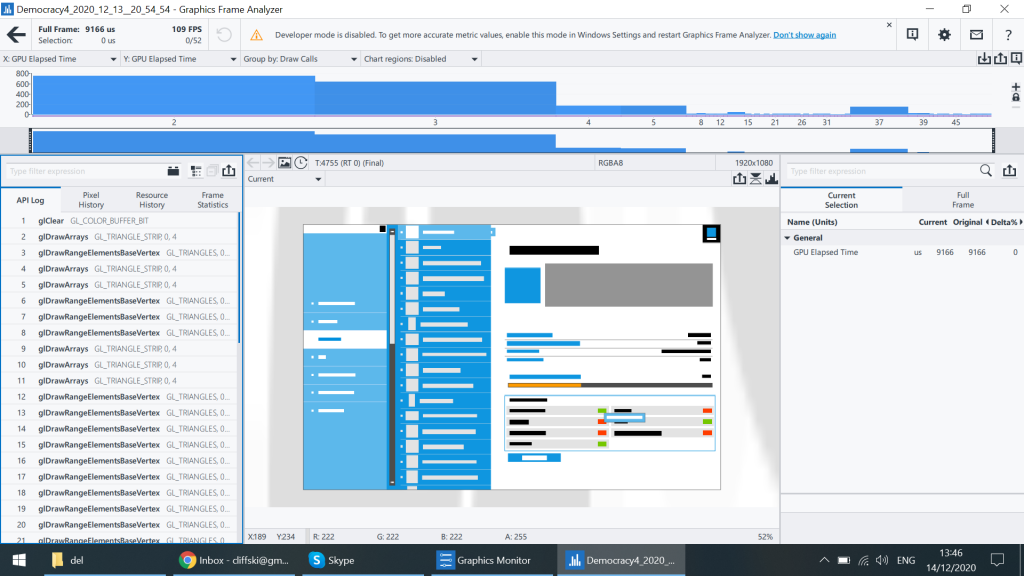
Let me here you shout ‘109 FPS with only 52 draw calls!‘. Its also worth noting that this means less processing in general, and thus less power-draw, so that laptop battery life will last longer for games that have fewer draw calls per frame. Its a missive win.
There is actually a lot more I can do here. Frankly until I get to that tooltip right at the end, ALL of the text on this screen can be done in a single drawn call near the end. The same is true of a bunch of other icons. Essentially all I have done here is optimize the left hand side of the screen, and there is scope to go further (and when I have time I will).
I thoroughly recommend you keep (or get) an old laptop with a low spec video card, and slap the intel GPA tools on there. Other such suites of profilers exist for GPUs, the AMD one is pretty good, and nvidia have nsight as well. It all depends on your GPU make obviously.
I do wish more people were aware of the basics of stuff like this. Its hugely rewarding in terms of making your game more playable. BTW these tools work on the final .exe, you don’t need a debug build, and the engine is irrelevant, so yes, you can use them on your unity games no problem.
Hope this was interesting :D