So…. In the complete and utter absence of any interest from curators, youtubers, the traditional press, or platform/store people to promote games these days… how is a struggling indie able to get any eyeballs on what they make? I guess its back to the wonderful world of adverts…
So I have been running facebook ads for AGES, and have loads of stats, and recently decided to break out excel and go through some stats on how advertising spend to promote production line stacks up against actually earning a profit. This stuff is extremely opaque, and because valve will not let devs have any kind of store page conversion tracking…we have to guess as to how our promotional efforts work :(
So I have a big spreadsheet that tracks the following things on a daily basis:
- Ad spend on that game for that day
- Raw steam revenue for that game (and its DLC) that day
- Estimated net revenue after valves cut, chargebacks, returns etc
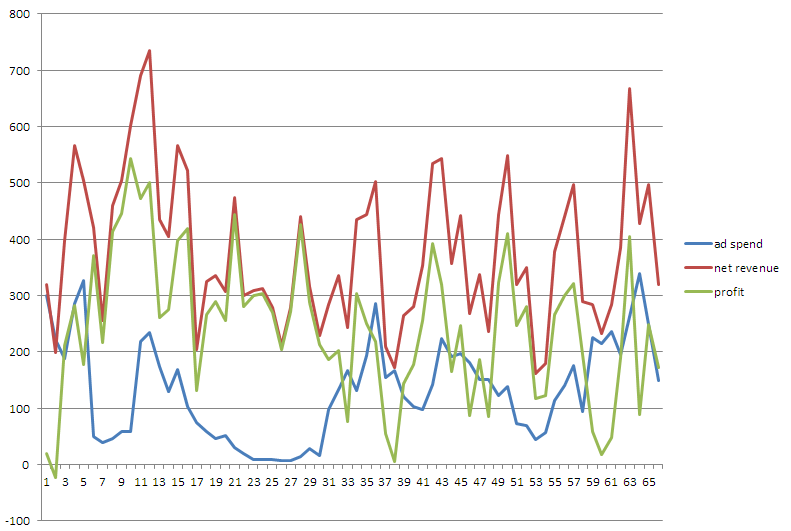
So if I look at a nice selection of 48 days (not during discount sales) data, I can plot these against each other and then analyze them in various ways to see whether I am doing something sensible or not. To do this I am just comparing columns of data using the excel CORRELATE() function, and the results are thus:
A raw correlation over those days of ad spend vs revenue gives this:
Simple ad spend vs revenue correlation: 0.50
Thats positive, which is yay! showing that I *am* actually driving revenue (not mere eyeballs, which is obviously working…) from my ads.
If I look at the correlation of ad revenue to profit I get:
Simple ad spend vs profit correlation: 0.39
which is weaker but still good, implying more ad spend == more profit. However, this is pretty useless as a metric, because the impact of an ad is likely not instantaneous. Someone sees an ad, follows a link, then thinks ‘gee! what an awesome game! (they are 1950s sitcom schoolkids), and then they add it to their wishlist to remind themselves to buy it the next day, or some such effect… so really I should look at pairs of day spending against pairs of days profit, to iron that out giving me this result:
rolling 2 day ad spend vs rolling 2 day profit: -0.32
Which is kind of wtf? If I go one steps further and average things over groups of 4 days I get this:
rolling 4 day ad spend vs rolling 4 days profit: 0.92
Hmmmm. This is a positive result, but actually I wonder if I’m actually doing it wrong. After all.. if there is not much variety between the ad spend on a given day, or profit on a single day, then how can I really draw conclusions. I probably need to go on a financial analytics course or do a lot of reading to understand this.
For example, if I do a correlation of a days ad spend, against the profit of that same day PLUS the 3 following days, I get a NEGATIVE correlation (only just) suggesting this is all bullshit :D
What I really need is some way to assess what the correlation is, and revenue really attributable to ads is… given the level of confidence I can get from the level of volatility in my ad budget... or what I imagine is called ‘volatility adjusted correlation’?
A bit of googling suggests this is called R squared, or ‘adjusted coefficient of determination) and on my rolling 4 day figure I get an RSQ of 0.84. I *think* this suggests that I can sensibly attribute 84% of the variation as being correlated, so effectively 84% of my profit each day is attributable to ads? Or is it that I can be 84% convinced that 92% of my profit is due to ads? In that case roughly 79% of my profits are ad-driven…?
No wonder most devs are confused by this stuff… I need to go back to school.