So today I added the first few new fighters to my GSB 2 engine. As a result, for the very first time I noticed the release mode build looking like it wasn’t running at a full 60 FPS at 1920×1200. My target is a healthy 60 FPS at 2560×1440, so this will mean some proper optimizing. I thought I’d keep a diary here of my investigations. First step is to do a ‘releasesymbol’ build (release build with debug symbols) and run aqtime pro, my optimizer of choice, to look for CPU slowdowns. This is an instrumenting profiler so it will be slooow…..
My initial invesdtigation shows that 50.68% of the time is drawing the battle, 31.62% is processing the frame. I decide to concentrate on the frame processing first, as this is easier to potentially multithread…

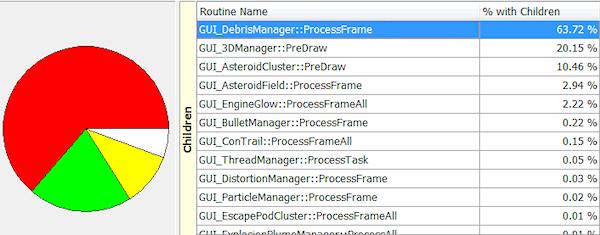
So pretty clear I need to work on the debris processing. This is already being multithreaded though… digging deeper it seems that a sorting function takes up 99.95% of that time, and 99.73% of *that* time is spent in GUI_DebrisCloud::Clear() ouch. It’s immediately obvious that per-frame sorting is mega overkill anyway, but why is clear so slow? Aha, because it involves removing the object from another, less optimised list. Ouch… Some digging shows I only add it back to that list later in the frame anyway, so this is entirely redundant, so thats a very easy win! Next lets look at the GUI_3DManager::PreDraw().

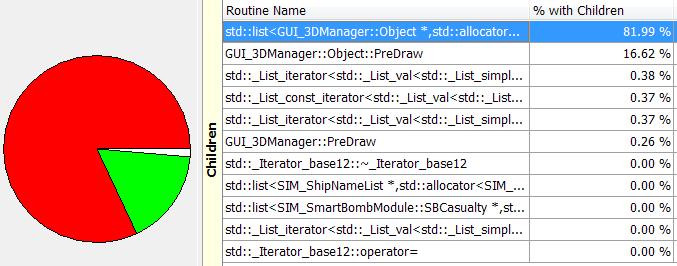
Yikes. Looks like STL is not being my friend at all here. A bit of investigation is called for… Again, this is an STL sort algorithm. I suspect I may have an unusually long list of items to sort there, and some digging suggests that this list has about 400 items in it. Not a lot, maybe the actual sort comparison is slow? No it’s a simple float comparison. what can be going on? is the STL list sort() really that inefficient for so small a list? apparently so. My options are to replace it with a vector (which makes removes/inserts a bit slower) or sort less often, or find a way to reduce the list size. The sorting is already being done why other threads are busy. I’ll experiment with a switch to vectors. While I’m at it, lets take a look at the slowest stuff inside the battle drawing…
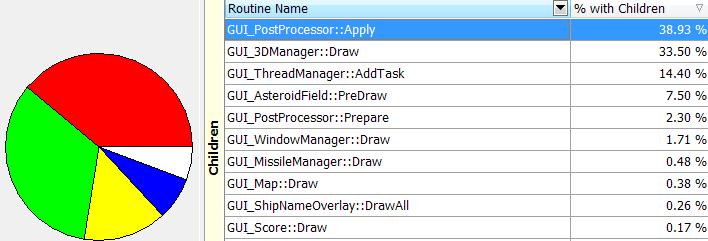
 Looks pretty clear that my post processing is slow, but as I recall, thats actually where most of the real drawing takes place… Some digging shows me that the main culprits are my lighting compositing and my lens flare streaks. This is the dreaded code where I read back from the rendertarget, which I knew would be hellishly slow. I *could* do it every other frame, and ‘lag’ very slightly. I *could* reduce the amount of the data I need to read-back, but I suspect this isn’t the problem. A tricky problem, whereas looking into the lightmap stuff I find a whole bunch of STL list iteration going on. I have mused before about using some fixed size (but big) arrays instead in this area… I also think I’m simply doing *too many* single sprite draw calls here, multiple ones for each fighter (don’t ask!). I’m pretty sure I can make some safe assumptions that compress those fighter layers into one, meaning an instant 50% less ship draw calls, so I’ll try that too… In fact some of them had THREE layers. ouch. Right thats three changes so lets go through the old sloooow profiling again. (results not 100% same as I’m not doing a scripted playback…)
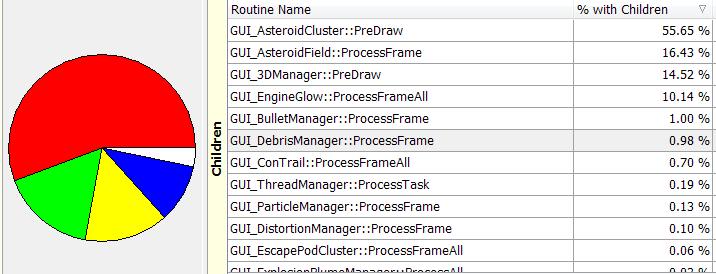
Right then, first thing is that DrawFighting() is now taking 58ms vs 74ms, so already a nice phat boost. (is this microseconds? I think so, it doesn’t matter :D). ProcessFrame takes 10.61 vs 46.19. Oh yeah! The new frame processing looks like this:
 Weirdly my reduced layers have made no difference. previously the ‘drawunlit’ function took 4.48,s, the new version takes 4.53. I’m now making 360 draw calls per frame, previously it was 442, but thats had zero impact. Maybe the draw call count is harmless at this point? Interesting. (I make many other draw calls per frame, this is just a certain function). The 3DManager sort time went from 10.5ms to 1.628, so a massive win. So far I am 2 victories, 1 damp squib. I can see some asteroid related slowdowns, but they aren’t in all maps and I’m looking for broad wins here… I just spotted 484 calls per frame to ship::IsOnScreen(). This is possibly an inefficient function, as it cycles through layers and checks for each layer being onscreen, without any ‘quick win’ bounding box clauses… I’ll add a sanity check fast ‘if ship center offscreen by twice our hull size, then quit’. That *must* be faster… I can check this fast without a whole long profiling battle so…
Cool, that function is now 10x faster. yay! 3 out fo 4.
In my browsing I now spot this beast:

What the hell? I was only flying along, there were no distortion waves, let alone roughly 1,000 new ones per frame. This sounds like a complete balls-up! Actually this looks like the profiler getting confused, possibly by some release build optimisation. It does draw my attention to a list I fill each frame… There are 3 slowdown in this,. the creating a new object for the list (tiny struct), the function call to add it, and the actual list push_back. This is all slow. it looks like I am already caching the objects, but clearly it’s not enough. Luckily AQTime lets me profile line-by line…
 Hmm, so as suspected lists just suck for this purpose. I need to sort out my caching (I actually suspect the max cached objects is just too low…) but I’m going to have to switch to vectors or ideally just an array for this stuff. Less convenient, but it clearly will boost performance.
Anyway… I’ll keep plugging away. I love this stuff. I fully expect the game frame rate to double by tomorrow. This is early days easy win stuff.