Hey. I’m a games programmer who has been coding for 38 years (yes really) and making indie games for twenty. Thus… I’ve done a lot of it, and learned from a lot of mistakes. I still do not consider myself an expert (who does?) but I’ve stuck primarily with one language (C++) and have used a lot of optimization tools over the years, so I’m simply passing on what I know about making your game run faster in the year 2019.
Disclaimer: if you are making games in unity then… you are on your own. I have no idea what tools are available in unity (although talking to friends makes me suspect they are pretty…lacking). Frankly if you are relying on someone else’s engine code that you can’t change then you are probably fairly screwed anyway, performance wise. For everyone else…read on :D
First of all, its worth getting some perspective. The first modern games I tried to write were on the intel 386dx2 processor. The speed of my current chip (intel i7 6700 @ 3.40 GHZ) compared to that is…vast. I can’t even find stats for such an old chip, so zapping forwards a lot I guess I can compare my current chip to an intel Pentium 4 1500…
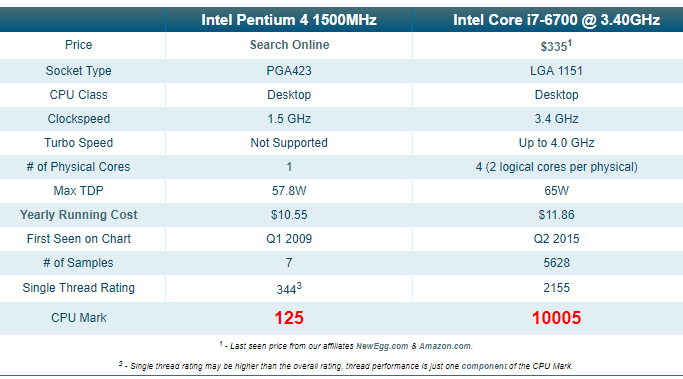
So frankly my current chip is about 80 times faster than one from 2009. And lets not kid ourselves that 2009 was the stone age. 2009 games looked PRETTY GOOD. So in the year 2019 (let alone the 2015 of my current chip), everything should be running silky smooth at 60 FPS (minimum) and with a UI that is as responsive as lightning right?
We all know this is not the case. Games still have performance problems. My point is that we should only be seeing performance problems in extreme cases now, when we are really pushing a machine to its limits to process incredible amounts of data, or render insane amounts of pixels, or applying insane effects to them. As an indie game developer, you are unlikely to be making Battlefield V style graphics, so your performance problems should be easy to solve right?
The biggest problem is that many developers just have NO IDEA what options there are out there to work out WHERE your performance problems are. I intend to show you some of them. (Click to enlarge any screens.)
Option #1 The visual studio profiler.
Obviously this is built in, so free with the IDE. I use a slightly older version of Visual C++ to the current one, and the profiler seems…ok, but a little basic. I get the impression its similar to the unity tools. It seems to want to tell you what to do, identifying specific functions that *it thinks* are the problem, rather than just giving you data and letting you investigate. Its very limited when it comes to actual visualization.
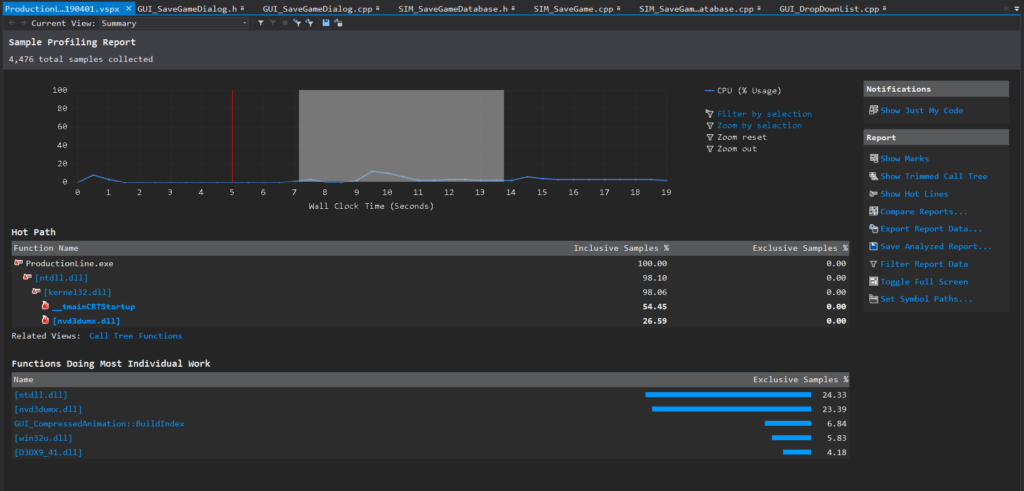 (default after-run screen of the profiler. Not much help tbh)
Now sure… this sort of thing is 100x more useful than no profiling at all (or horror of horrors: trying to measure your own code using hacked timers…), but frankly its pretty badly put together compared to dedicated 3rd party tools. Still…its built in I guess? I hardly bother using it.
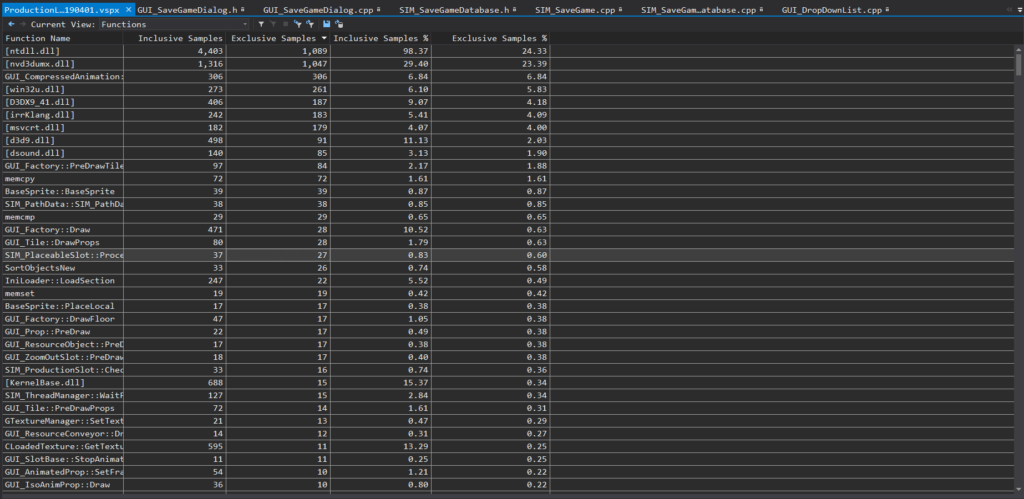 (one of many uninspiring views in the visual c++ profiler)
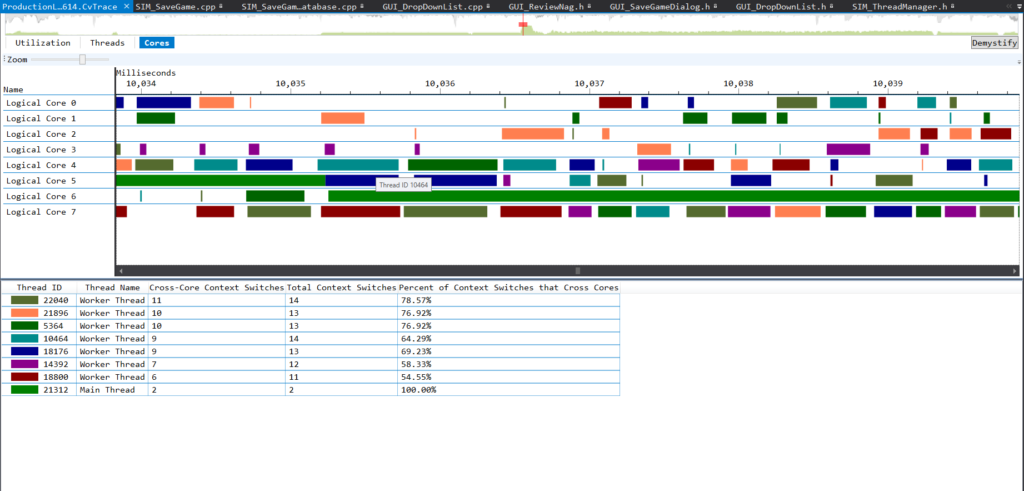
Option#2 The visual studio concurrency visualizer.
In my version this is an ‘optional add-in’ which frankly is essential if you do multithreaded code (and if you don’t…omg why?) Its one of the best tools imaginable for visualizing where one thread is blocking another in a specific frame. It has truly excellent support for you adding in your own named sections, markers and events that let you build up really detailed and helpful pictures of why one thread is waiting for another. Given the ‘free’ price, its highly recommended, and probably the simplest tool for visualizing how your game is handling multi-threading.
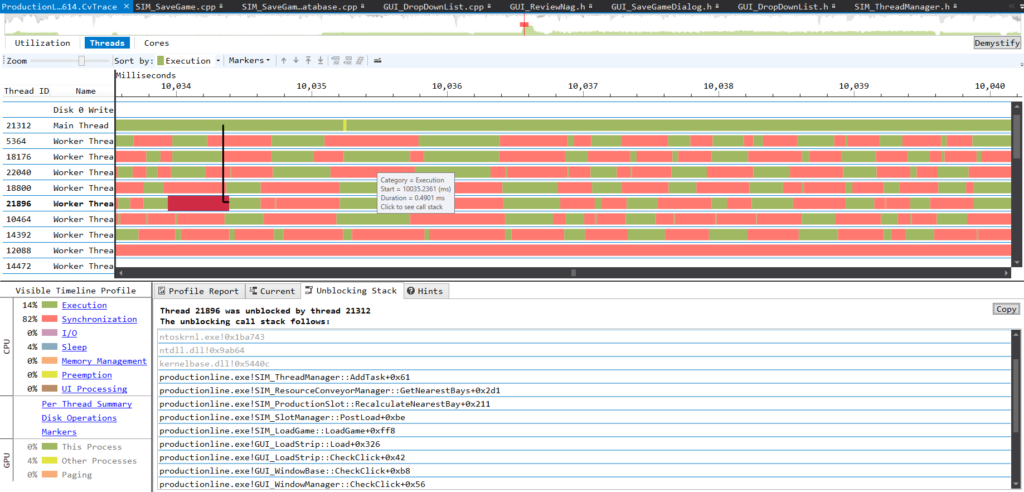
It also has a baffling but I guess kinda cool view where you can see the relationship between actual threads and physical cores which shows them bouncing all over the place. Frankly I think this tool is made redundant by vtune, but like I say, its free and integrates nicely into visual studio. If you place custom code markers into it, it gets very helpful indeed.
Option#3 NVidia Nsight.
A visual debugging system thats free for nvidia card owners. This is great for GPU debugging, as it lets you freeze your game in real time, and then generate a ‘frame-scrubber’ view, where you can step through each individual draw call in a specific frame and watch every mesh get rendered, one at a time, and see the textures that were used, and what was changed on screen. This is *great fun*. if you ever have a bug where something is being drawn in the wrong order, this is how you spot it. This also allows you to spot those cases where you do far too many draw calls that could be easily batched. I’m doing too many draw calls here:
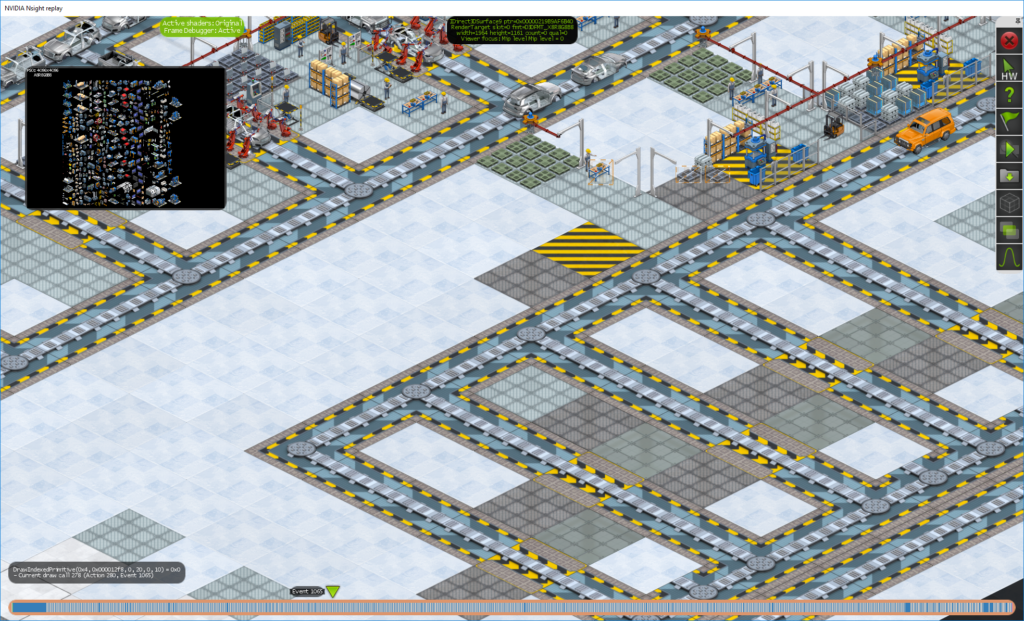 (nsight scrubber half way through a frame render showing current draw call texture atlas)
Nsight also has a system to let it run on a remote PC (which is cool), and has some nice little visual tools like the ability to visualize overdraw or to set all textures blank to see if its texture memory that is acting as a frame rate blocker. A real-time histogram shows you how many polys are being rendered by each draw call, which lets you spot parts of your games where you need more batching. Its very useful for games that are graphically complex, and where you need to visualize which items are taking up too many draw calls.
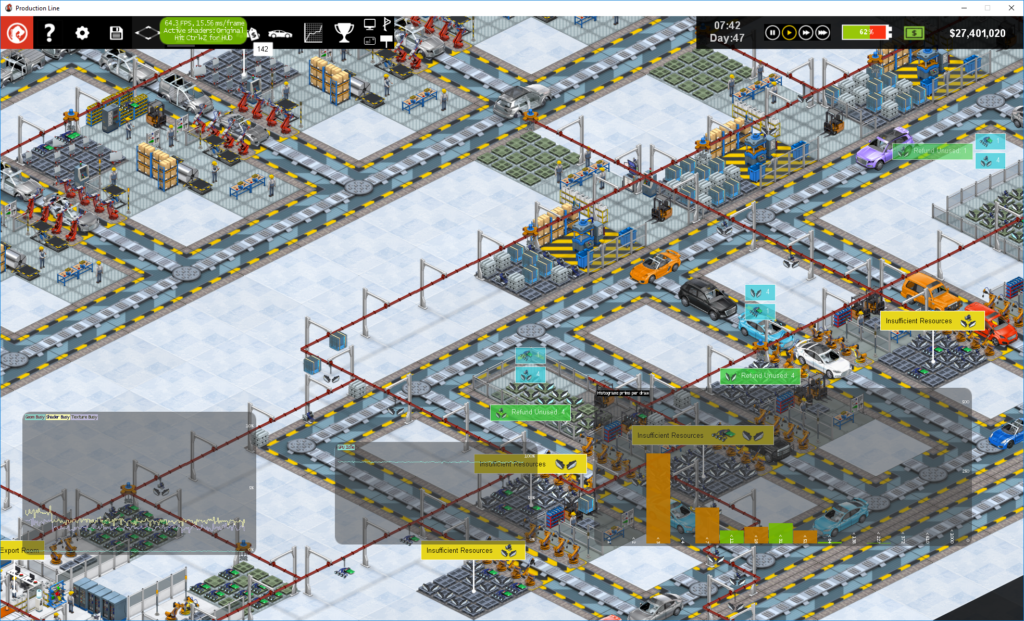 (nsight real time view showing GPU busy chart and draw call histogram)
Option #4 AQTime (by SmartBear) (approx $650)
This is commercial profiling software that I’ve used for years. it does an extremely good job of working out exactly what line of what function is slowing you down, which it does over the entire lifecycle of running the program. You can programatically (or manually) turn data collection on or off if you only want to capture a specific part of the run, but you have to do that at run time, not after the event, which is less than ideal if hunting for a specific slow frame.
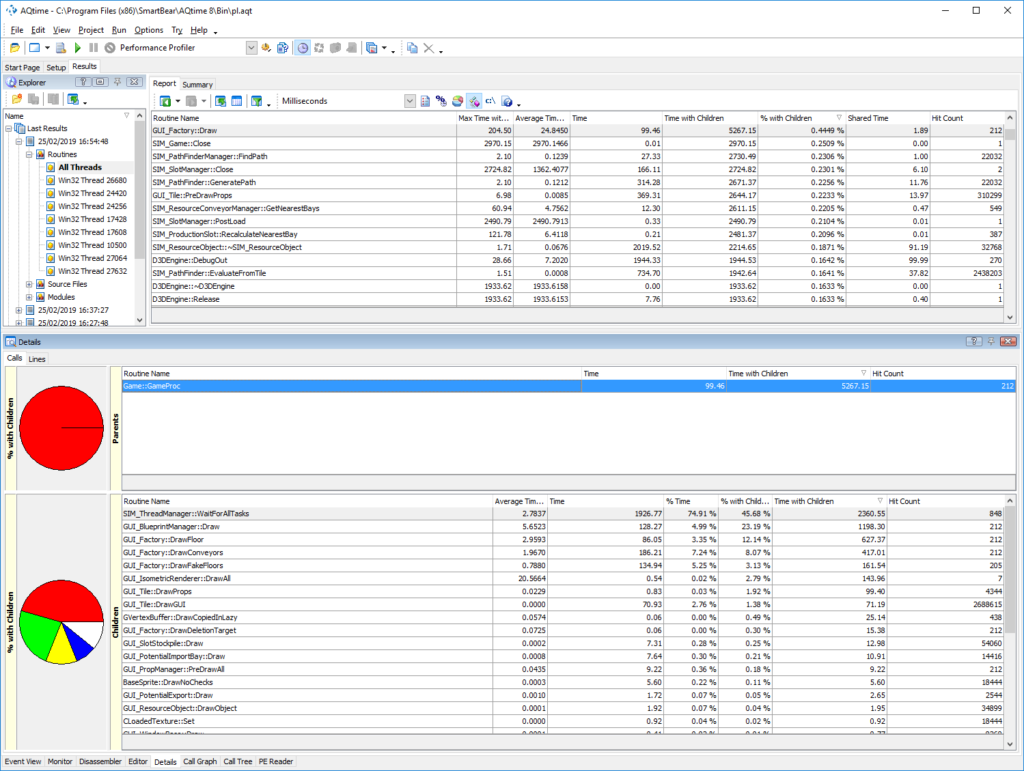
AQtime has exceptionally good stability, and is very good at visually allowing you to ‘drill down’ into code and see where a bottleneck is. Its absolutely rubbish at concurrency analysis (although you can view the results of each thread individually, you cannot detect blocking). It gives some really cool charts, and will even let you switch to see the source code alongside profiling data, and even the assembly code if you really want to.
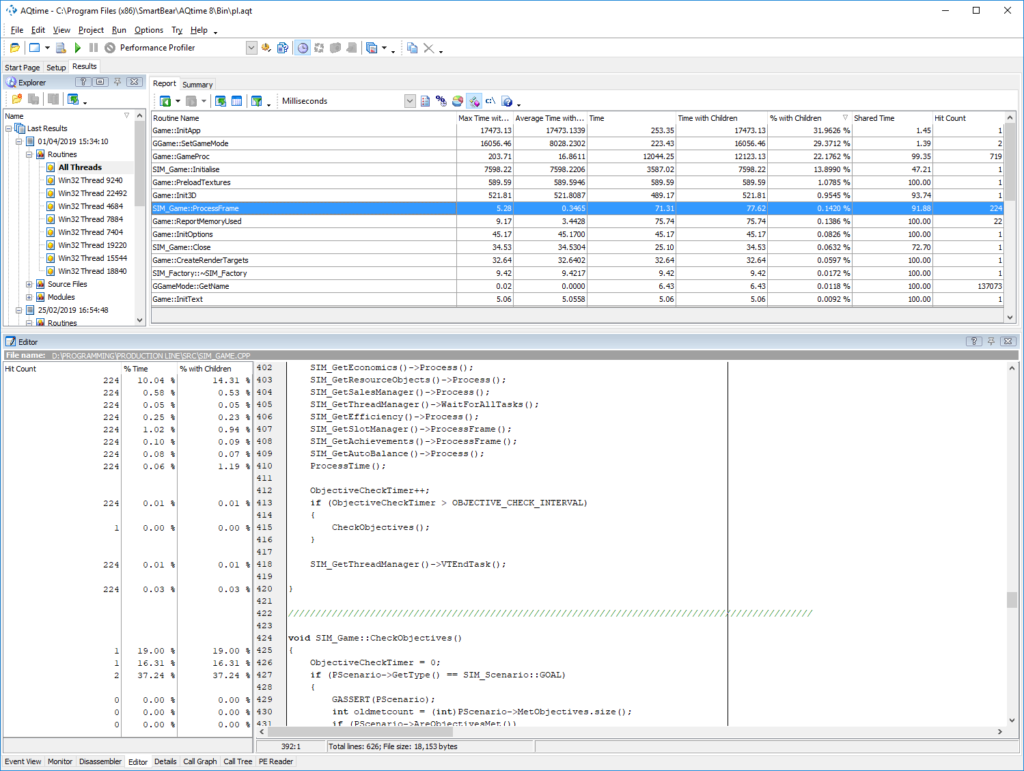
I’ve found that owning a copy of this is annoying (it has some serious low level service-based DRM), and its very much aimed at trying to get you to buy a new update every year, but if you can ignore that and deal with the company, and the price, its actually very good. I’ve used it for hundreds and hundreds of hours. Running aqtime WILL slow down your code a lot (especially in line-analysis mode) but its worth it to get the data. Its also quite good at analyzing memory usage.
Option#5 Intel VTune Amplifier.
Ok this one has a free trial that seems to never end so…I dunno. I don’t understand either. In the past I’ve paid the full £800 or so for this, and it was worth it.This is a full-on serious profiling tool that integrates into visual studio but can also be launched externally. Its a very low level beast, and produces gigabytes of profiling data. By default it limits its capture to 2GB of data, and thats *not a lot*. You will not leave it running for hours. Like many profilers, it has multiple modes and methods and rules. I tend to use its concurrency analysis mode which provides incredibly complex data like this:
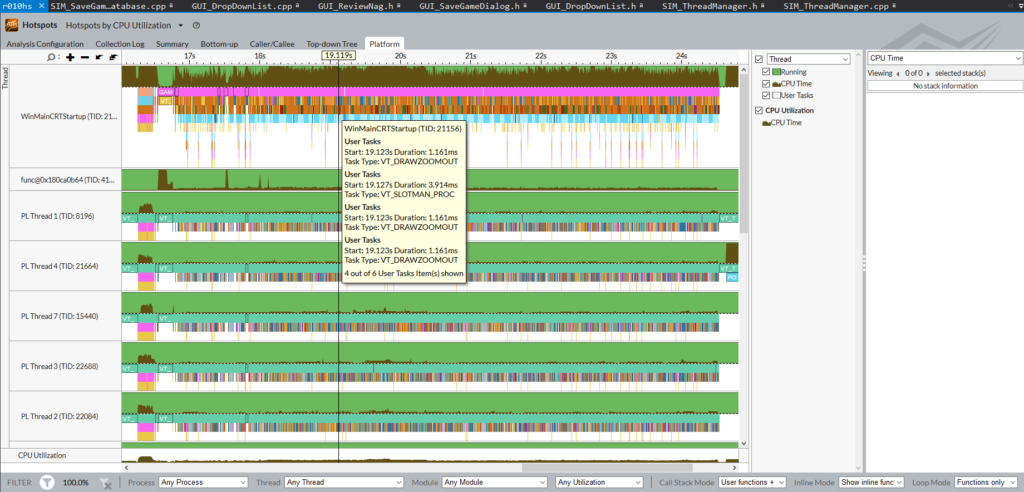
Frankly the UI for it is as stable as a canoe carrying heavy industrial equipment, but its numerous crashes aside, its a seriously amazing bit of software. Treat it gently and it rewards you with incredible details, and also makes you strongly aware of how your code is just part of the story, with directx, drivers, and the O/S also having to do quite a bit of stuff while your game runs.
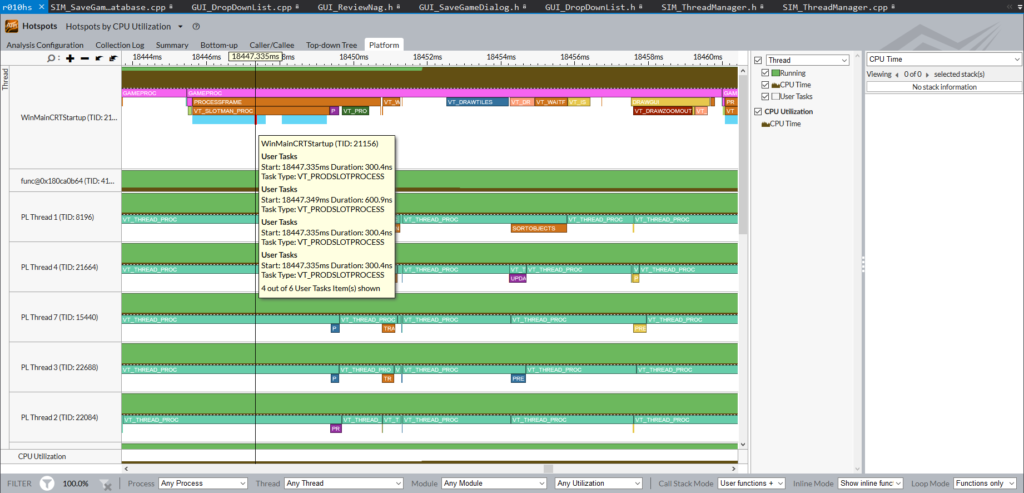
Like the concurrency visualizer, you can place your own markers in the code to label each bit of data and you can stack them a seemingly endless amount of times to give you amazing drill-down. For multi-threaded apps, this is a goldmine of information that just is *not* there with a normal, simple profiler.
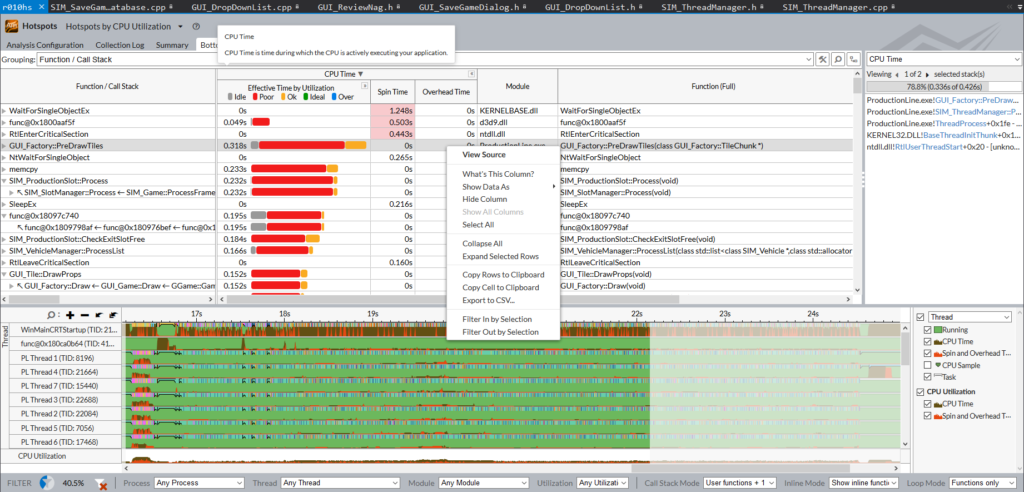
I also find that its very good at letting you view the bottlenecks in code very well when you only want to select a single, very specific frame where stuff goes wrong. Honestly you could probably spend years just looking at the data of a single run of your game and still be learning new stuff.
Conclusion
Learning to use these tools takes months, and learning to apply the knowledge from them takes years. I’m only part way into the lifelong process of understanding what makes code slow, and how to fix that, but the important thing I want to get across is you need to know how to MEASURE this stuff.
Just running a function a thousand times with timegettime() at the start and end tells you NOTHING, other than that you really need to get a profiler. Increasingly code is running on a machine with multiple cores sat idle and without a really good way to analyze and visualize the inter-relationship between code running on different cores, you are basically trying to optimize with one hand tied behind your back and a patch over one eye.
There are some great free profilers, and even the commercial ones will pay for themselves. Unless your game already runs perfectly at 60FPS even on 5 year old hardware, you absolutely need to learn how to use one.
(if you found this post helpful, check out my games)