Want to see a GRATUITOUS graph of some sales stats for one of my games? I bet you do. People love info-graphics, especially those really long vertical things with lots of numbers. I’m not going to do one of those, but I will present to you for your delight the following sales graph showing two weeks of income on an un-named website…
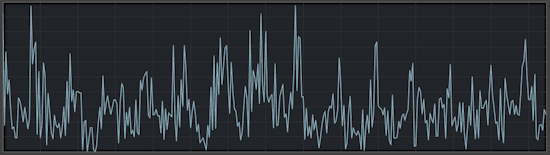
If you sell games online, you may well have seen similar looking graphs when looking at your own data. The thing is, just staring at a graph doesn’t help you much unless you can tie it in to the events that have influenced that data. After all, people like me are always talking about return on investment, marketing, publicity, and how to get attention, and how to convert visitors into buyers and all that kind of stuff. In other words, sales data is USELESS. What you need is sales data with context. So lets add that in the version below…
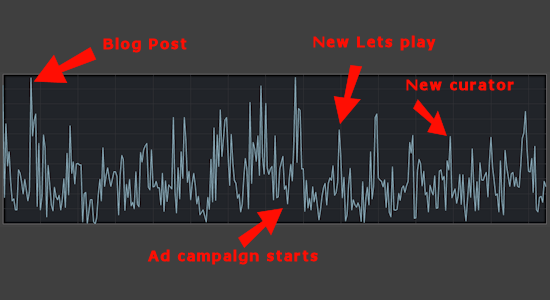 Now this is actually something useful, because we can use the sales data, in combination with our recent marketing efforts to deduce what is working, what is not, and how best to approach marketing and business stuff as we continue to promote and sell this indie game. You can tell immediately that the blog post where we mentioned the game resulted in a notable spike in sales, that the ad campaign had a big, but very short-lived boost, and that a new lets play that someone did had actually only a pretty small impact on our sales, ditto a new steam curator that listed the game.
From this we conclude that we should put more effort into blogging, probably keep up the ad spending, but not be too bothered about encouraging lets plays and steam curators, as they have less of an impact on our bottom line.
Except no, hold on.
That’s all bullshit.
Lets look at the real graph, through the lens of realizing that the top point on those spikes was about $1k a day, and that the game has been out a while now. We could zoom out and look not at two weeks data, but at a years data, and then with that context taken into account we can re-formulate the data for those two weeks as follows:
…
…
scroll down…
…
…
… keep going
…
…
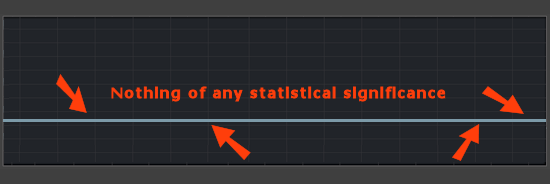
Basically fuck-all happened in those two weeks. Did I blog about the game? Probably. Did we get a new lets play. Maybe. Did we get some new steam curators. I think we might of, I’m really not sure. But regardless what happened, it made absolutely sod all difference to our sales.
Do not fall into the trap of over-extrapolating information from noise. It is VERY VERY tempting to do so, especially when you are a new developer because you desperately want to know how sales for your game will be, and you desperately want them to be good. The problem is, as a new developer your ability to analyze this data is very very low, simply because (unless you made banished) your sales are likely, with your first game, to be low enough that any change in them is statistically irrelevant.
If you sell 5 games a week, and then suddenly one week you sell 7, thats a huge percentage boost in sales. Sales have SKYROCKETED. Sales are ‘up in a big way’. There has been a ‘boost’ in sales! But really there has not. Really, one of the people who bought last week told 2 of his friends how good the game was. This is a trivial thing you cannot analyze and cannot benefit from analyzing.
If you sell 5,000 games a week, and then suddenly sell 7,000 that IS actually significant, despite being exactly the same variation. You absolutely should draw conclusions from it.
That seems counter-intuitive, so keep re-reading it. The margin of error is basically lower with a big sample size. This is why pollsters try to have a decent sample size, so one or two outliers don’t skew the result. In our 5 sales example, we lucked out and one of the 5 had lots of similarly minded gamer friends. The thing is, we could have gone entirely the other way, we might havebeen unlucky, and sold to 5 people with even less friends than normal, and this might actual dent the next days sales as our ‘virality’ collapses. A single customers sociability can skew our popularity up or down hugely.
With 5,000 customers, we are going to get lots of sociable customers, AND lost of unsociable ones. They cancel each other out, and we get a steady stream of recommendations, and non-recommendations. Unless one of the buyers is notch or stephen fry, them tweeting about our cool game will make zero difference, in the grand scheme of things.
The vast majority of indie game post-mortems over analyze events in their sales curve. It’s absolutely worth reading them for the ‘we made a game about chickens and it was a hit’ or ‘we made a mobile game and then we ended up living off noodles’. That’s ‘big picture’ stuff. But buying an advert or releasing a trailer and seeing your sales go from 5 to 7, or 7 to 5, is a total irrelevance. Ignore it.
Tell me if I’m wrong :D