Ok, it’s been about a month, so lets look at some solar stats for the last 30 days. ( I have 10 solar panels outside my office window, for those new to the blog. I’m in the SouthWest UK)
Total power generated is 189 units. That’s 189 kwH, which at market prices is £23.62. Bad huh?
But wait a second… I earn 3p per exported unit (50% is assumed) and 43p Feed-in-tariff, regardless of usage, plus of course the 12.5p per unit the power would have cost me if I’d had to buy it. That means that really, each unit generated earns me 57p a unit, meaning I’ve generated £107.73. If we wanted to go mad, I’d claim 12 months of that is £1,292 :D
Obviously summer output is WAY higher than winter, but as a counter to that, we have had a shit 30 days in terms of sunshine (unusually so, the month before install was insanely bright).
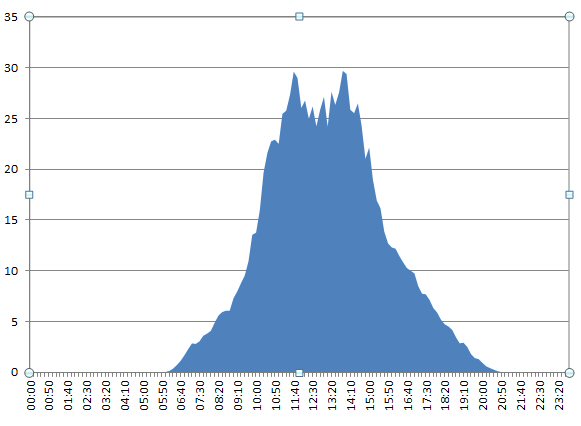
Another reason to be cheerful in terms of future output, is that we have a big tree casting serious shade around 4PM. We knew about this, obviously, but didn’t realise the extent to which the late afternoon/early evening sun was going to be so bright here. Given that, we may well lop a few feet off the top (it’s BIG) and hopefully that should boost output a fair bit.
here is a chart showing the aggregated output over the time of day…
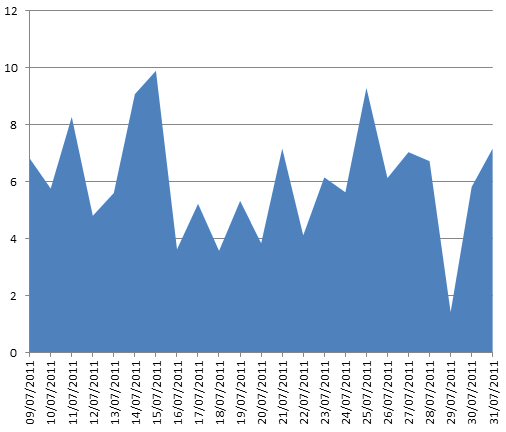
 And a chart showing how massively it varies each day:

I’m sure I’ll be equally boring and geeky when we have lopped a bit of the tree and had a few days without it. Of course, then the sun will be lower overall…. Bah. comparing data is such a pain.