Game Design, Programming and running a one-man games business…

Coding a load-balanced multithreaded particle system

Background: I am coding a 2D space-based autobattler with ridiculous levels of effects called ‘Ridiculous Space Battles‘. I code my own engine, for fun, in directx9 using C++ and Visual Studio.

Because I love coding, yesterday I found myself wondering how well the multithreading in my game was holding up. So I fired up the trusty Concurrency Visualizer in Visual Studio. I love this tool and have used it a lot on previous games. One of the biggest demands on the CPU for my game is particle processing. There are a LOT of explosions, and other effects, and a crazy number of particle emitters (thousands of emitters, hundreds of thousands of particles). Obviously this would normally be a code bottleneck, so I have a task-based generic multithreading engine that handles it. The main thread builds up a bunch of tasks, the threads grab the next task on the list, and the main thread will wait until the task list is empty. If there are still tasks in the queue, the main thread will do one as well. So how did things look?

Disastrous!

So what is going wrong here? I have a generic ‘marker’ set up to show the span of the main thread’s drawing of the game (GUI_Game::Draw()). Inside that, a bunch of unlabeled stuff happens, but I added spans to show when the multithreaded task called UPDATE_PARTICLE_LIST is called. There are two massive things going wrong here. Firstly, there are only two other threads joining in to process the particles, and secondly one of those updates seems to take 20x as long as the other. Worse still, its the one the main thread chose… so its a huge bottleneck. Technically this is still a speedup, but its marginal. How have I fucked up?

Some background to my rendering algorithm is needed: The game has 2 blend modes for particles. A ‘Burn’ mode, that saturates color and is used for fire, lasers, sparks etc, and a ‘Normal’ mode for smoke and debris etc. The particle effects are batched as much as possible, but I cannot mix those blend modes in a draw call. Also, some particles are below the action (the ships) and some above, to give a semi-3D look and make it look like the explosions engulf the ships. So this means particle emitters fall into one of 4 lists: NormalBelow, BurnBelow, NormalAbove, BurnAbove. This is all fine and works ok. In action, the game looks like this:

Because you can freeze frame and scroll around, everything has to be properly simulated, including particle effects currently offscreen. Anyway it all works, and I have FOUR particle emitter lists. So naturally, to load-balance everything, I gave one list to each thread and considered the job done.

BUT NO.

It turns out that those 4 groups are not equal in size. They are laughably unequal. The ‘BurnAbove’ list contains all of the fire and spark emitters on all of the pieces of all of the hulks from destroyed ships, plus sparks from fiery plasma torpedoes, expended drone explosions, and missed or intercepted missile explosions. Thats MOST of the particles. When I checked, about 95% of particles are ‘BurnAbove’. I had 4 lists multithreaded, but they were not vaguely really load balanced.

Once I realized that the solution was theoretically easy, but fiddly to implement and debug. I decided I would add a new load-balanced list system on top. I created 8 different lists, and when an emitter was created it was added to the ‘next’ list (the next value circled round through all 8), and told what list it was in. When it was deleted, it was removed from the appropriate list. Note that ‘deleted’ is a vague term. I delete no emitters, they get put into a reusable pool of dead emitters, which complicates matters a lot…

So in theory I now have a nice load-balanced series of 8 lists that contains every particle emitter that is currently live. The original 4 lists are still valid and used for rendering and blend mode data, but this ‘parallel’ list system existed alongside it, purely to handle load-balancing. What this means is, that a load-balanced-list may contains particles from all 4 render groups, but this does not matter as I am running update code on them, not rendering!

It didn’t work.

Crashes and bugs and corrupt data ahoy. I worked on it for ages, then watched a movie to try and forget it. Then this morning, after some digging, it was all fixed. What actually was going wrong was related to smoke plumes. Because there are a lot of smoke plumes, and they always reuse the same particle config data, they exist in a separate system, updated separately. I had forgotten this! And what was happening was my new load-balanced lists stupidly included these emitters when they should have been kept out of it. The emitters would expire and be deleted in the multithreaded code, then later accessed by the plume code. CRASH.

I worked it out this morning before breakfast! I was very pleased. You might be thinking, what about the only 2 threads thing? LOL I had hard coded the game to use maximum of 4 threads, probably as a debug test. Idiot. I just changed it to be 10 and everything worked:

This is more like it. I wasted ages trying to get the dumb concurrency visualiser to show my custom thread names instead of ‘Worker Thread’ but apparently thats the category. Not much help. FFS show us the thread names! (They work in the debugger). But anyway, that image above is a snapshot inside a busy battle for the GUI_Game::Draw() showing how UpdateParticles tasks get spread over 8 threads. I’m still not sure why that sixth thread misses out on a task, which gets nabbed by the main thread…

Anyway, the point is it works now, and in theory updating particles is 8x faster than it would be with single threading. I do need to apply the multithreading to a lot more of the game code to get the best possible results. I am testing this on a fairly beefy GPU and CPU (Ryzen 9 5900X 12 Core @3.7GHZ and RTX 3080) in only 1920×1080 res. I want the game to look awesome at 5120 res or on a five year old cheap laptop, so plenty more to do.

If for some reason this tips you over the edge to wishlist the game, here is the link :D.

Optimizing load times

I recently watched a 2 hour documentary on the ZX spectrum, which means little to people from the USA, but it was a really early computer here in the UK. I am so old I actually had the computer BEFORE that, which was the ZX81, just a year earlier. The ZX81 was laughable by modern standards, and I expect the keyboard I am using has more processing power. It had an amazing 1kb of RAM (yes kb, not MB), no storage, no color, no sound, and no monitor. You needed to tune your TV into it and use that as a black and white monitor. Its this (terrible) PC I used to learn BASIC programming on.

Anyway, one of the features of ZX81/Spectrum days was loading a game from an audio cassette, instead of the alternative, which is copying the source code (line by line) from a gaming magazine and entering the ENTIRE SOURCE CODE of the game if you wanted to play it. Don’t forget, no storage, so if your parents then wanted to watch TV and made you turn it off, you had to type the source code again tomorrow. I can now type very fast… but the documentary also reminded me of another horror of back then, which was the painfully slow process of loading a game.

These days games load…a bit quicker, but frankly not THAT much quicker, especially given the incredible speed of modern hard drives, and massively so when talking about SSDS. Everything is so fats now, from SSD to VRAM bandwidth, to the CPU. Surely games should be able to load almost instantly…and yet they do not. So today I thought I’d stare at some profiling views of loading a large battle in Ridiculous Space Battles to see if I am doing anything dumb…
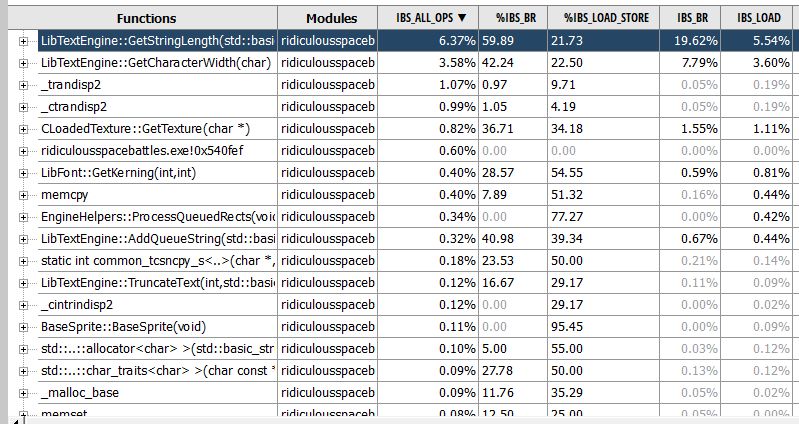
This is a screengrab from the AMD UProf profiler. My desktop PC has an AMD chip. I’ve started the game, gone to the ‘select mission’ screen, picked one, loaded the deployment screen, then clicked fight, let the game load, and then quit. These are the functions that seem to be taking up most of the time. Rather depressing to see my text engine at the top there… but its a red herring. This is code used to DISPLAY text, nothing to do with loading the actual game. So a better way to look at it is a flame graph:
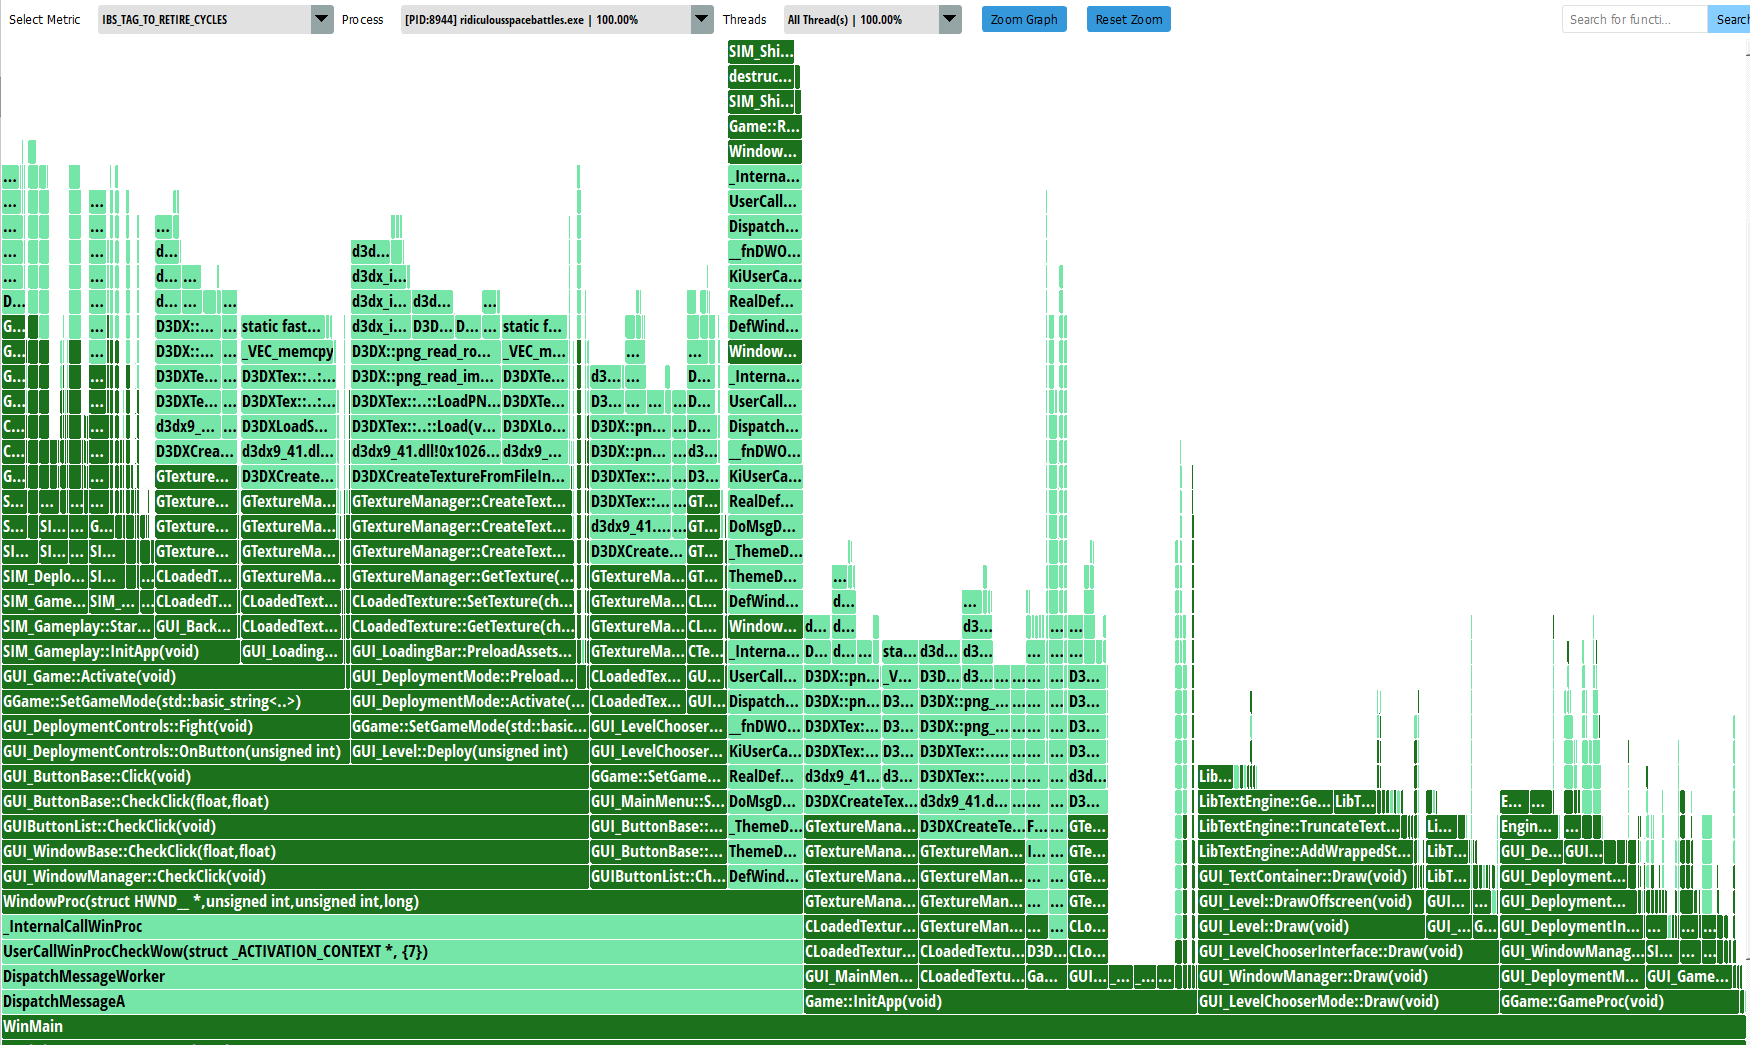
I love flame graphs. They are so good at presenting visual information about where all the time is going, and also seeing the call-stack depth at various points. This shows everything I did inside WinMain() which is the whole app, but I can focus in on the bit I care about right now which is actual mission loading…
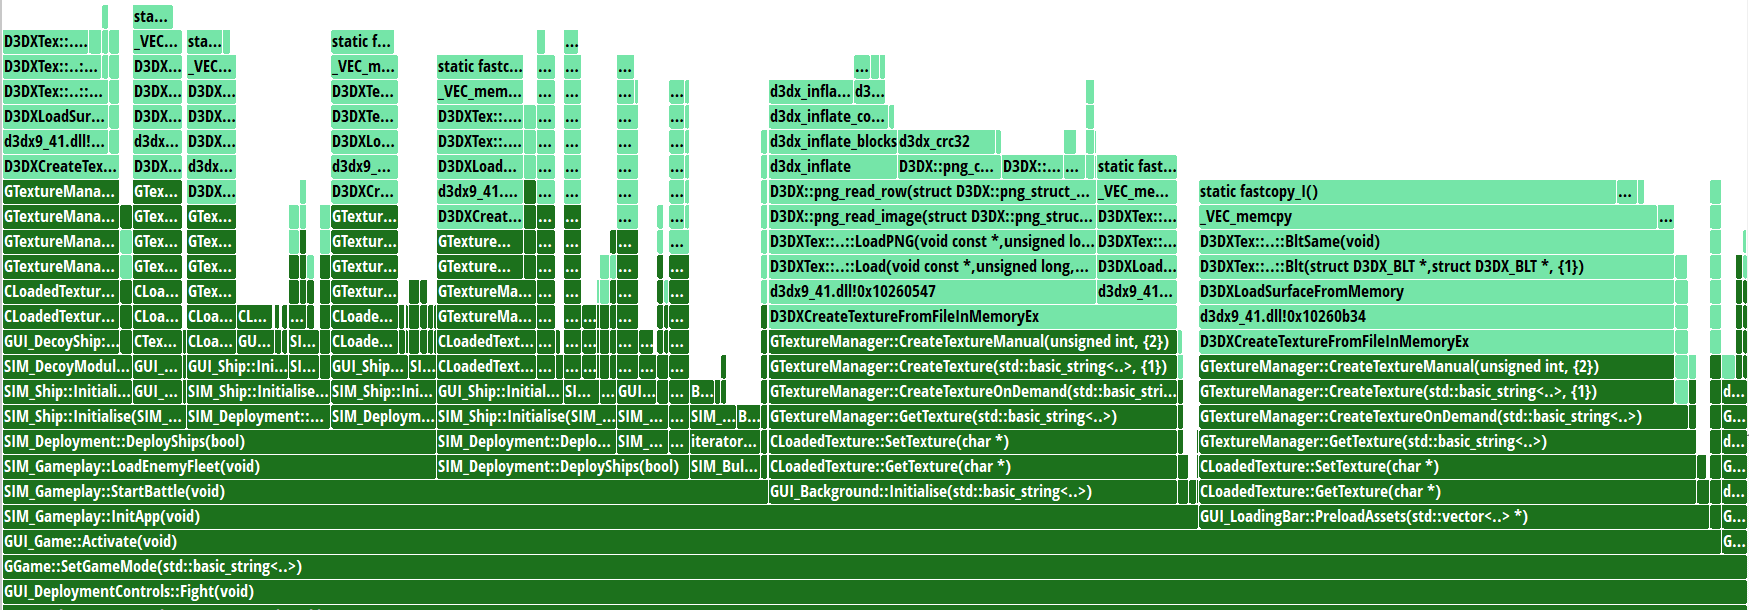
And now its at least relevant. It looks like there are basically 3 big things that happen during the ‘loading battle’ part of the game, and they are “Loading the ships” “Loading the background” “Preloading assets”. The GUI_LoadingBar code is given a big list of textures I know I’ll need in this battle, and it then loads them all in, periodically stopping to update a loading progress bar. Is there anything I can do here?

Well ultimately, although it takes a bit of a call stack to get there, it does look like almost all of the delay here is inside some direct9 functions that load in data. I am very aware of the fact that directx had some super slow functions back in directx9, in its ‘d3dx’ API, which I mostly replaced, but ultimately I am using some of that code still, specifically D3DXCreateTextureFromFileInMemoryEx…

Now I have already tried my best to make stuff fast, because I’ve made sure to first find the texture file (normally a DDS format, which is optimised for directx to use) on disk, and load the whole file into a single buffer in RAM before I even tell directx to do anything. Not only that, but I do have my own ‘pak’ file format, which crunches all of the data together and loads it in one go, which presumably is faster due to less windows O/S file system and antivirus accessing slowdowns. However I’m currently not using that system… so I’ll swap to it (its a 1.8GB pak file with all the graphics in) and see what difference it makes…

Wowzers. It makes almost no difference. I wont even bore you with the graph.

And at this point I start to question how accurate these timings are, so I stick some actual timers in the code. In a test run, the complete run of GUI_Game::Activate() takes 3,831ms and the background initialise is just 0.0099. This is nonsense! I switched from instruction based to time-based sampling in uprof. That doesn’t now give me a flame graph, but it does also flag up that the D3DX png reading code is taking a while. The only png of significance is the background graphic, which my timers suggest is insignificant, but I think this I because it was loaded in the previous screen. I deliberately free textures between screens, but its likely still in RAM… I’ll add timers to the code that loads that file.

Whoah that was cool. I can now put that into excel and pick the slowest loaders…

Loaded [data/gfx/\backgrounds\composite3.png] in 73.0598
Loaded [data/gfx/\scanlines.bmp] in 20.0463
Loaded [data/gfx/\planets\planet6s.dds] in 11.8662
Loaded [data/gfx/\ships\expanse\expanse_stormblade_frigate_damaged.dds] in 10.7132
Loaded [data/gfx/\ships\ascendency\g6battleship.dds] in 9.3622
Loaded [data/gfx/\ships\ascendency\g5frigate.dds] in 6.9765

OMGZ. So yup, that png file is super slow, and my bmp is super slow too. The obvious attempted fix is to convert that png to dds and see if it then loads faster. Its likely larger on disk, but requires virtually no CPU to process compared to png so here goes… That swaps a 2MB png for a 16MB (!!!!) dds file, but is it faster?

NO

Its 208ms compared with 73ms earlier. But frankly this is not an accurate test as some of this stuff may be cached. Also when I compare pngs of the same size, I’m noticing vast differences between how long they take to load:

Loaded [data/gfx/\backgrounds\composite11.png] in 113.9637
Loaded [data/gfx/\backgrounds\composite3.dds] in 208.7471
Loaded [data/gfx/\backgrounds\composite5.png] in 239.3122

So best to do a second run to check…

Loaded [data/gfx/\backgrounds\composite11.png] in 112.8554
Loaded [data/gfx/\backgrounds\composite3.dds] in 84.9467
Loaded [data/gfx/\backgrounds\composite5.png] in 108.4374

WAY too much variation here to be sure of whats going on. To try and be sure my RAM is not flooded with data I’d otherwise be loading, I’ll load Battlefield 2042 to use up some RAM then try again… Interestingly it only takes up 6GB. Trying again anyway…

Loaded [data/gfx/\backgrounds\composite11.png] in 114.0210
Loaded [data/gfx/\backgrounds\composite3.dds] in 85.6767
Loaded [data/gfx/\backgrounds\composite5.png] in 105.8643

Well that IS actually getting a bit more consistent. I’ll do a hard reboot…

Loaded [data/gfx/\backgrounds\composite11.png] in 104.3017
Loaded [data/gfx/\backgrounds\composite3.dds] in 207.8332
Loaded [data/gfx/\backgrounds\composite5.png] in 141.2645

Ok so NO, a hard reboot is the best test, and swapping to DDS files for the huge background graphics is a FAIL. These are 2048 x 2048 images. At least I know that. The total GUI_Game::Activate is 7,847ms. That png is only about 1-2% of this, and it makes me wonder if converting all the dds files to png would in fact be the best solution to speed up load times? The only other option would be to speed up DDS processing somehow. Having done some reading, it IS possible to use multithreading here, but it looks like my actual file-access part of the code is not vaguely the bottleneck, although I’ll split out my code from the directx code to check (and swap back to a png…)

Creating texture [data/gfx/\backgrounds\composite11.png]
PreLoad Code took 1.0205
D3DXCreateTextureFromFileInMemoryEx took 111.4467
PostLoad Code took 0.0001
Creating texture [data/gfx/\backgrounds\composite3.png]
PreLoad Code took 28.4150
D3DXCreateTextureFromFileInMemoryEx took 71.1481
PostLoad Code took 0.0001
Creating texture [data/gfx/\backgrounds\composite5.png]
PreLoad Code took 0.9654
D3DXCreateTextureFromFileInMemoryEx took 105.2158
PostLoad Code took 0.0001

Yeah…so its all the directx code that is the slowdown here. Grok suggests writing my own D3DXCreateTextureFromFileInMemoryEx function, which sounds possible but annoying.

Ok…mad though it sounds, I’ve done that. Lets try again!

Creating texture [data/gfx/\backgrounds\composite11.png]
PreLoad Code took 0.8327
D3DXCreateTextureFromFileInMemoryEx took 103.4365
PostLoad Code took 0.0001
Creating texture [data/gfx/\backgrounds\composite3.png]
PreLoad Code took 0.6053
D3DXCreateTextureFromFileInMemoryEx took 73.9393
PostLoad Code took 0.0002
Creating texture [data/gfx/\backgrounds\composite5.png]
PreLoad Code took 0.9069
D3DXCreateTextureFromFileInMemoryEx took 105.0180
PostLoad Code took 0.0001

Am I just wasting my life? at least I now have the source code to the DDS loader because it is MY code bwahahaha. So I can tryu and get line level profiling of this stuff now… I’ll try the visual studio CPU profiler:

Thanks Microsoft. But there may be more…

The Visual studio flame graph is saying that actually the raw reading from disk of the file IS a major component of all this, and so is a memcpy I do somewhere… Actually its inside the fast DDS loader, so the flame graph is confusing. The DDS loops doing memcpy calls for each line of data. This is very bad. With a big file, there will be 2,048 calls to memcpy just to read it in. Surely we can improve on that? and yet its clear thats what D3DXCreateTextureFromFileInMemoryEx is doing, as seen earlier. Hmmmm. And now people have come to visit and I have to stop work at this vital cliffhanger…

Is this game you designed actually any fun?

When you develop an entire game by yourself, there is a staggering amount of work to do. Coding, business stuff, marketing, testing, balancing, designing. And I think that the majority of people who ‘want to make video games’ tend to over focus on the design bit. The whole ‘I have an idea for a cool game’ bit. It might surprise people to know that this is the bit that I am least fond of. In many ways I am a cross between an AI/Engine coder and an entrepreneur who realizes he has to design games to sell that code inside. The whole ‘working out how the game will play’ side of things has always been hard and frustrating for me.

You might find this an odd thing for me to say for two reasons: Firstly, I’ve made a bunch of (I think) pretty innovative games. Kudos was the first turn-based life-sim game (AFAIK). Democracy was the first commercial game designed around a neural network and based on the aesthetics of infographics. Gratuitous Space Battles was the world’s first auto-battler game. There is no shortage of innovation there. Secondly, not many game developers would ever admit they don’t enjoy the game design bit. Thats the bit we are supposed to excel at right? Admitting you don’t enjoy that bit as much is almost blasphemy.

As is probably obvious, I’m autistic, and one of the ways this manifests is that I like, and even need… data. You can tweak your ad campaign or marketing strategy and see if sales go up or down by 1%. You can re-engineer your code and check that performance has gone up or down by 1%. But game design? How on earth do you know the game is fun? How do you measure if you are making the game BETTER with all those changes… or worse? And in the absence of such data, what the hell are you doing?

I think most fulltime game designers seem insecure, as they are always asking other people if what they are doing is any good! We have to, because its very very hard to tell. In some ways, designing a game is like writing a joke. You can put a lot of effort in, have some skill, lean on prior experience, but by the time you are finished working on the joke, it stopped being funny to you personally ages ago. If you spend your entire day staring at spreadsheets of weapon characteristics until your eyeballs are sore, the question ‘Is this spreadsheet fun?’ feels almost insane. There is a good reason many game designers are NOT avid players of their own games after release. We are too close to it, too aware of the mechanics, too aware of the areas we are not sure about. We saw the sausage being made, and we do not want a sausage sandwich for breakfast.

This might sound a bit depressing, and it would be more so if this was my first rodeo, but I’ve experienced it before as a musician. For probably 20 years, I was unable to just ‘enjoy’ music. I would listen to it from a technical point of view. I might marvel at the clean guitar tone, the incredible timing, the complexity of the arpeggios, but I was listening to it from a teacher and student point of view, not as an audience member. I can now mostly just enjoy music, but I’m still aware of the keys and scales and techniques…

Being ‘too close’ to your own work will always be a problem. You will not be sure your joke is funny, your novel is gripping, your music is cool or your game is fun. Its just impossible for someone so close to the system to evaluate it in the same way a customer would. There are however, ways to get around this!

One is obviously to ask a lot of people. Friends, family, fellow game devs. The trouble is that these people are normally pre-disposed to worrying about hurting your feelings. Not many people will say to me “Cliff, this sounds boring as fuck”, although over the years I’ve managed to find people who know me well enough to be aware they can be more honest with me than other people. Even so, its not disinterested feedback, and if all your friends are game designers too, you are hardly getting a representative slice of the consumer base.

A second technique is time. Take a weekend off, or a week off. Ideally a month off. Some novelists stick their work in a drawer for a YEAR and then come back to it fresh, and can evaluate it with a far better critical eye. Of course the problem here is you need to earn money, but if you can work on multiple games at once and swap them over, this might be an option. Its definitely a system that works.

A third technique is drugs. Yes I went there. I am quite boring in that my narcotic of choice is just good old fashioned alcohol. Its not like I am permanently drunk when designing (am I making this denial too strongly maybe?), but I *do* drink, and I do my best to learn to ‘channel’ the feeling of being drunk when thinking about game design. The reason? when you are uninhibited, you have a different emotional response, and I think that change in emotional response gets you closer to the enthusiasm of someone seeing your work for the first time. Drunk cliff can watch a battle in Ridiculous Space Battles and have no greater design insight than “WHOAH LASERS!”, and if thats the response to my game, then I am totally fine with that.

In fact ‘Whoah Lasers!’ is a good name for a game.

Anyway, I offer this blog post as counterpoint to the idea that game design is something that you can get from a text book and can be quantified and analyzed with ‘player verbs’ and ‘core loops’. Ultimately what you are trying to do is make something FUN and this is no different to making something FUNNY. Its folly to suggest there is an equation for either humor or fun. Making something with either of these attributes is hard, and fuzzy and it doesn’t come easily to everyone. Certainly not me.

But obviously I need to reassure you that Ridiculous Space Battles will be totally fun. Its currently 92.65% fun by I am optimizing it. You can wishlist it now etc. Wouldn’t that be fun! (am I funny?)

Optimising Ridiculous Space Battles

Due to what seemed to be a compiler bug (omgz) yesterday I thought that large complex battles in Ridiculous Space Battles were hitting performance limits. That appears to not be the case, but it got me back into profiling the bigger battles (20×20 grid size, with up to 25 ships in each square, probably 600 ships in total) to see where the bottlenecks are.

The game is already multithreaded for some tasks, but the first profiling runs for he first 50% of a battle gives me this flame graph from uprof for the main thread:

In practice what I really care about is stuff inside GUI_Game::Draw(). I have to say I am pleasantly surprised with the breakdown as it seems nicely distributed, without any real obvious processor hogs at first glace. Drawing the ship sprites, processing the simulation, post processing (mostly lightmaps), particles, hulks, bullets and then a bunch of minor stuff. Nothing seems too bad. On the other hand there are some things in there that seem quite big given what I know they are doing. For example the lightmap stuff shouldnt be that big a deal, and perhaps should be threadable more? Lightmaps are being drawn not only for every laser ‘bullet’ but also every engine glow, and every one of the many sprites that make up a beam laser. I also draw ship ‘mattes’ to ensure that light does not glow through objects like asteroids. Even so, this doesn’t sound like a lot of CPU?

So this breakdown is showing as expected that a lot of it is within the drawmattes, but even so that seems too much to me. There might be a single ship sprite, but 6 engine glows and the flares from 20 missiles or 6 beam lasers associated with it. How come mattes are so slow? At first I assumed that I was not checking to see if they were onscreen, but I definitely am. Here is the code for that function:

GUI_GetShaderManager()->StartShader("matte.fx");
for (SIM_Ship* ps : PlayerShips)
{
    ps->DrawMatte();
}
for (SIM_Ship* ps : EnemyShips)
{
    ps->DrawMatte();
}

GUI_GetHulks()->DrawMattes();

GUI_GetRenderManager()->Render();
GUI_GetShaderManager()->EndShader("matte.fx");

So nothing exactly too complex. It could be that just traversing the STL list for 600 ships takes time, but frankly 600 is not a big list. Could it actually all be the hulks? Actually uprof suggests a lot of it is… but checking that code, its basically doing the same thing. The game made a note early whether to render a hulk matte, so there is no redundant rendering taking place. Hmmm. Maybe best to look elsewhere for problems. I tried running a battle involving a ludicrous number of bullets. I gave the Expanse ‘Apocalypse Cruiser’ a huge bunch of Gravimetric impulse cannons which have lost of burst fire, and filled a fleet with them.

And the flame graph is actually not too bad again:

Ok, bullet process is now the top task, but it has not gone insane, which is good. And the bulletmanager Draw() is also obviously bigger, but again not insane. I dug a little deeper, and found this nonsense inside the bullet process function:

float radangle = D3DXToRadian(Angle);
float cosa = COS(radangle);
float sina = SIN(radangle);

Looks innocent, but I actually wrote faster versions of sin and cos that use a lookup table for 3,600 versions of each. So basically my precision there is within a tenth of a degree. I probably left it like this because I worried that the quantizing there would make the bullets look like they miss their target when my sim shows that they hit. I checked with grok:

The bullet could be off target by up to approximately 2.62 pixels when using a sine/cosine lookup table with 1/10th degree precision over a distance of 3000 pixels.

Thats interesting, because frankly none of my bullets are firing 3000 pixel ranges, and being visibly off by that amount is actually ‘no big deal’. Its absolutely not a big deal if the bullet has been pre-determined to miss anyway… I guess I *could* be super-cautious and have a flag where if the bullet will miss, I use the lookup table for its movement, and if not I use real math?

And then this is the point in the thinking process where I realize that all my code is bollocks. Its only when the bullets WILL hit the target that they need to change their angle once shot anyway. In other words, some bullets are (for sim purposes) effectively homing-bullets, and some are not. In other words, not only can I use a lookup table for the angles of non-hitting bullets, I do not even need to recalculate the angle for them at all once they have been fired. Jesus I need a coffee…

Coffee consumed… And now checking that this change (caching one-off sin and cos for missing bullets) works and does not break the game… And it works fine. I am now aware of a much bigger issue: When a bullet expires, it removes its sprite from the list of lightmaps to be drawn in the lightmap code. This is a big deal, because that list may well have 6-10,000 entries. Removing an item from a list that big all the time is hitting performance in this perverse case with thousands of bullets. I need a better solution…

Checking UProf I can see that GUI_Bullet::SetActive() has a cache miss rate of 66%. Thats pretty dire, the worst of the top 20 most processor intensive functions. Yikes. And yet…

2 minutes chatting to grok (XAI’s chatbot) gave me the frankly genius solution: “Why have a pointer to a sprite stored in a list, and then go back later and try and find it. When you add it, store the ITERATOR, and then later when you want to remove it, you already have the iterator ready. No more list searching.

Holy Fucking Crap.

I’ve been coding for 44 years, and its never occurred to me that with a tightly managed list of objects that will have constant addition and removal, and the list may be huge, that its worth storing the iterator in the stored object. Thats genius. Maybe you do this all the time, but its new to me, and its phenomneal for this use case. Not only is GUI_Bullet::SetActive() no longer in the top 20 functions by CPU time, I cannot even find it. Its literally too fast to measure, even with my extreme stress test.

Buy shares in NVDA and TSMC!