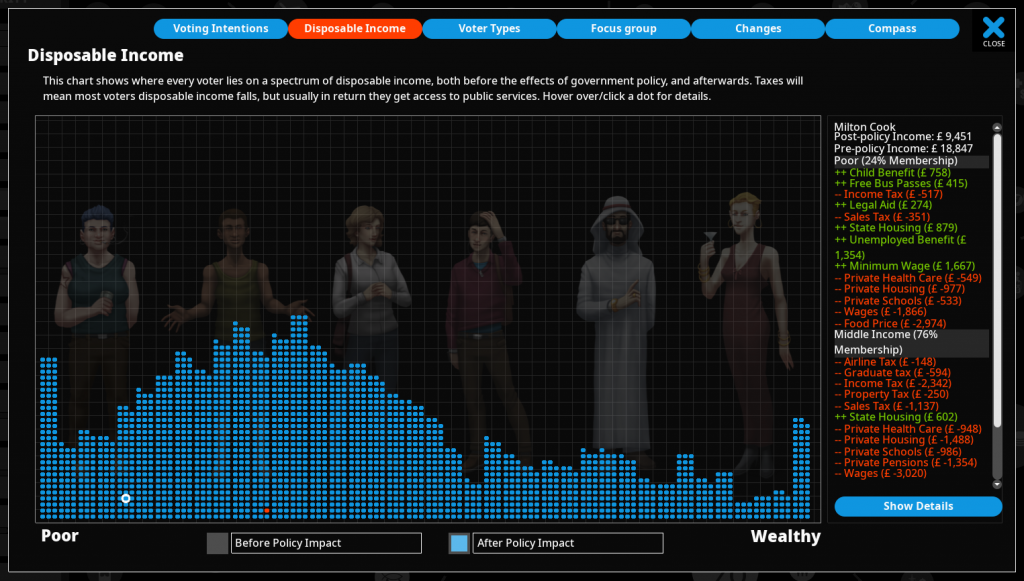
About a week ago I had this mad idea that it would be cool to plot every single Democracy 4 voter’s wealth on a graph, so that you could see where they were clustering in a nice easy-to-understand way. Within an hour it worked, within a day, a new rewritten version that looked much nicer with blue dots on it was done, and I was tweeting, and people were saying ‘yay’, and then everything went fucking mad.
By hovering the mouse over one of those blue dots, you could see a breakdown of how that persons income was affected by every government policy or situation, indirectly, through their membership of voter groups. This data already existed in Democracy 3, it was easy, it was just GUI code, and done really quick… and that showed me what an absolute mess the simulation was…
Democracy 1,2,3 and 4 are all coded as a homebrew neural network. Every neuron has a value either capped from 0->1 or -1->+1. Everything in the game is a neuron, a voter, a voter group, a policy, a minister, an event…everything. Voters also have an ‘income’ neuron which tracks how much money those voters have. So…in supersimplistic terms if you want to know why Bobs income is 0.78, you look at the 21 weighted inputs from all the voter group income neurons, and you see all the +0.2, -0.1,+0.32 etc, that adds up to 0.78. If you want to go one stage further up the hierarchy you can track the origins of those effects to policies etc.
Thats worked for 3 games perfectly. But its a crap system.
The trouble is, peoples incomes are on a 0->1 scale. And all effects are percentages. So for example if free bus passess give retired people a 0.05 income boost, that increases the income of all retired people by 5%. Fine?
NO
Because working class ex-street sweeper mavis just got a bus pass worth $500, but retired hedge fund manager Boris just got a buss pass worth $15,000. WTF? why does democracy hate poor people? The problem is that we have only ever been able to use effects to apply percentages to incomes. That means EVERY benefit, or tax, or effect is proprotional to your income. That means lambourghini drivers pay more in car tax than skoda owners (maybe intentional), but means the state pension depends on how wealthy you already are.
Its fixed. it was hard.
Basically I have had to code an entirely new shadow system of fixed-income neurons that can cope with values beyond 1, and then (this is the hard bit) written code that stitches it all back together internally so that we can still use the same mechansims to move people between middle-income and poor etc, and still display everything in the UI as though nothing has changed.
This was hellish, because it also means restitching together lists of totally different UI items on the fly with different calculation methods to come up with a result that looks the same as it used to. Its taken a week of fixing edge cases, checking, altering UI, and writing lots and lots and lots of code which mostly will go underappreciated :D.
But thankfully it now works, and it means we can have effects in the game which are +10% income of retired people, and also effects that are +$10,000 income of retired people, as the designer or modder sees fit. This means helicopter money can actually be fixed for everyone, free school meals no longer serve foie gras to rich students, and so-on.
You wont notice it immediately but its a massive improvement in the underlying simulation code in the game. It stressed me and tired me out so much to do it that im forcing myself not to code today so I can recover.