Have you heard of it? I had not either, but its a thing, and its a free thing, and its pretty cool. Its a similar tool to nvidia nsight, which I used to love, until they basically broke it entirely for older copies of visual studio. I would love to live in this delusional world where people make dev tools and think that every developer is sat there, staring at their code thinking ‘it would be great to take a few days off to install a new version of this IDE, with virtually no improvements, but lots of changes and incompatibilities. Plus I am tired of having money, take my dollars…”
FWIW I develop Democracy 4 with Visual Studio professional 2013. Its great. It works, and I don’t see any reason to ever upgrade. I think the previous version I had was one I sued for about eight years, so theoretically I might consider upgrading in 2021… but why would I?
The question should always be ‘why should I upgrade?’ not ‘why should I stay on an old version. an IDE is just a tool. My office chair is a tool, and I think thats about 8-9 years old now. I expect it to last another 10 years minimum. Stick with stuff that works well.
Anyway, lets talk about GPUPerfStudio!
This is a free tool you can get here. Its a way of debugging the way you draw stuff in your game, and it seems to support directx, opengl and vulcan whatever that is :D Its not flawless, but its pretty easy to setup and use, which is one of the most important criteria for devs like me who code everything, and thus the debugging of rendering issues is only a tiny part of my job… With that in mind here is a tutorial on how to use GPUPerfstudio with your game.
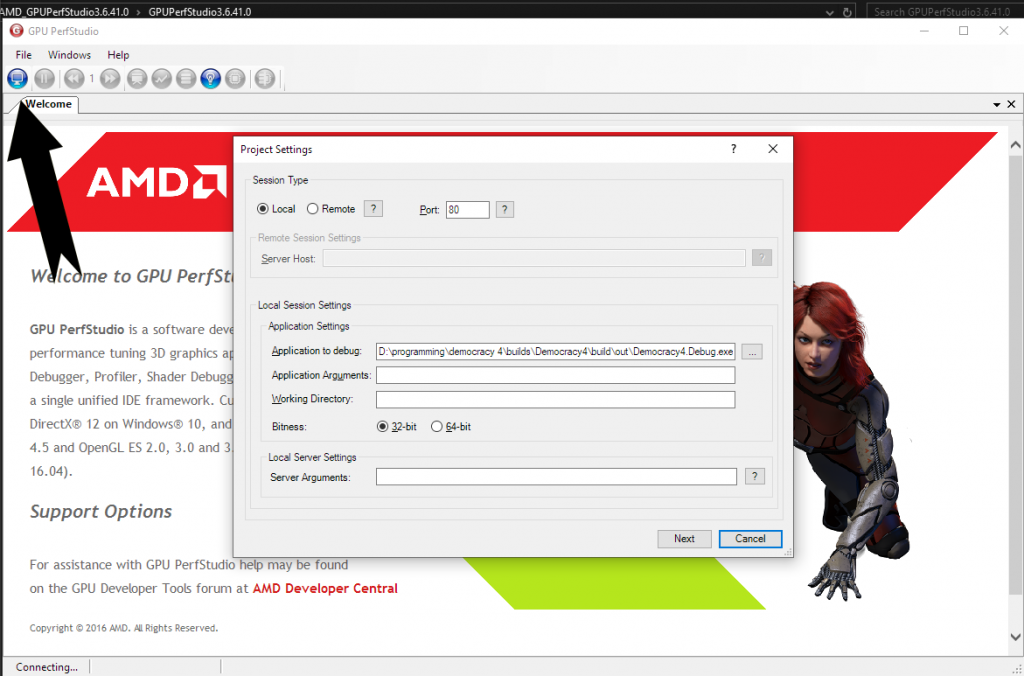
It seems all you do is download and unzip the thing into a folder, and launch the executable (GPUPerfClient.exe). BTW whats weird about this tool is that to actually run a program and debug it, you click this top left icon that looks like a monitor… whats wrong with a ‘play’ icon? You then browse to the path of your .exe file (debug or release builds are both fine, and click on ‘next’, then ‘connect’.
This then launches some command line window which you can ignore, and your actual app. It then pops up a dialog box for you to confirm what graphics API you are using, and wahey! you can run and use your app as normal until you get to a screen you want to analyze. When you are there, you click back to the GPUPerfStudio window and hit the ‘pause’ button. NOTHING happens! Until you click back to give your game window focus. It then takes a snapshot, and you are in business, and its time to hit that (now highlighted ) frame debugger button. This then generates some cool stuff:
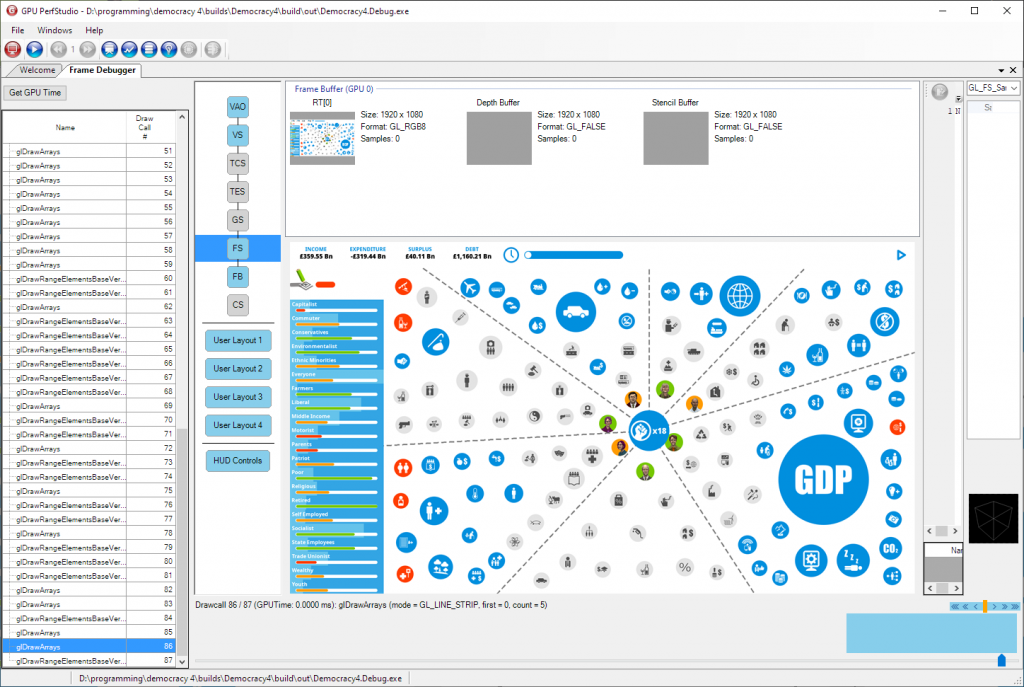
You need to click around on various stuff to get the layout the way you like, but to be simplistic about it, on the left hand side in a column of every draw call made to render this scene. To the right of that is a diagram showing the various stages in preparing and rendering each draw call, and to the right of that is a bunch of render targets and textures you can zoom in on by clicking on them. I’ve selected RT[0] which is essentially the screen, and selected one of the later draw calls. I’m not using fancy shaders so I don’t care about the RHS windows, I just want to see what is rendered when.
With that in mind, I can select an earlier draw call on the LHS…
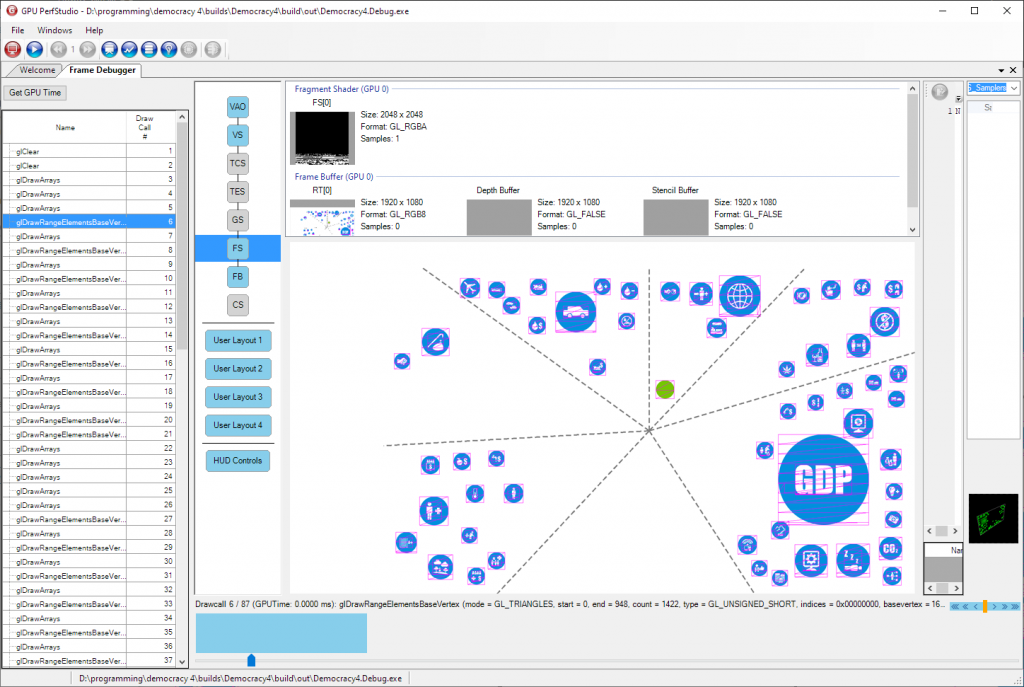
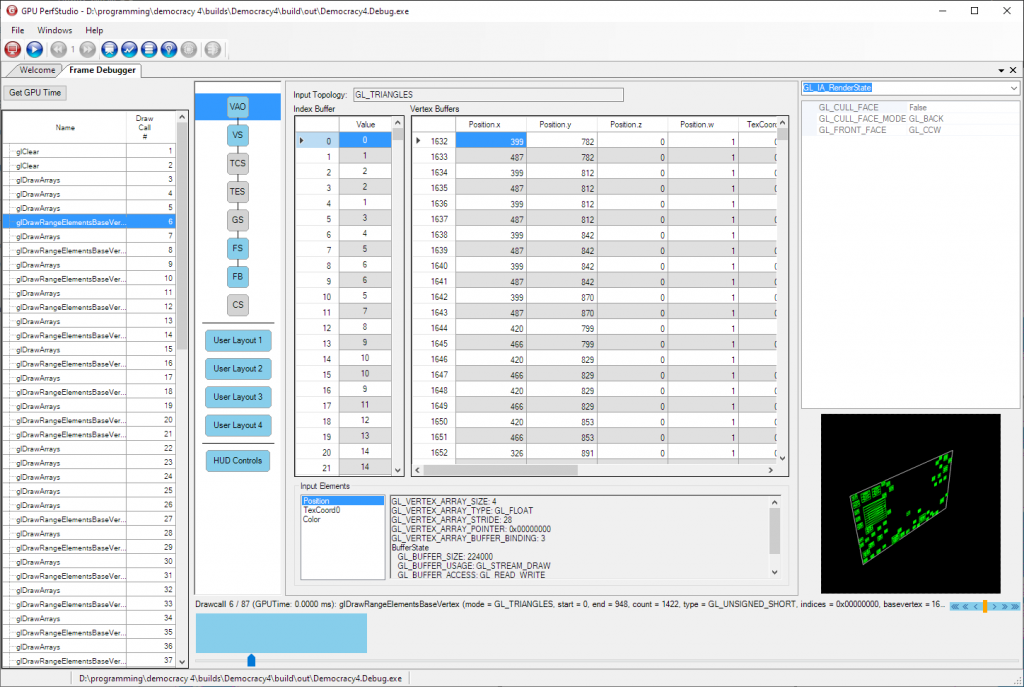
Tada! Thats draw call #6 where a bunch of icons get drawn to the screen. I can click on the source texture for all that and see how much of it using and what the source looks like, and if I want more detail on the actual draw call data I can click on VAO for the vertex stuff, and actually inspect the contents of the vertex buffer I’m using…
BTW the pink highlights on the screen texture are showing you the verts you draw in the current call, which is clearer if I look at a later draw call:
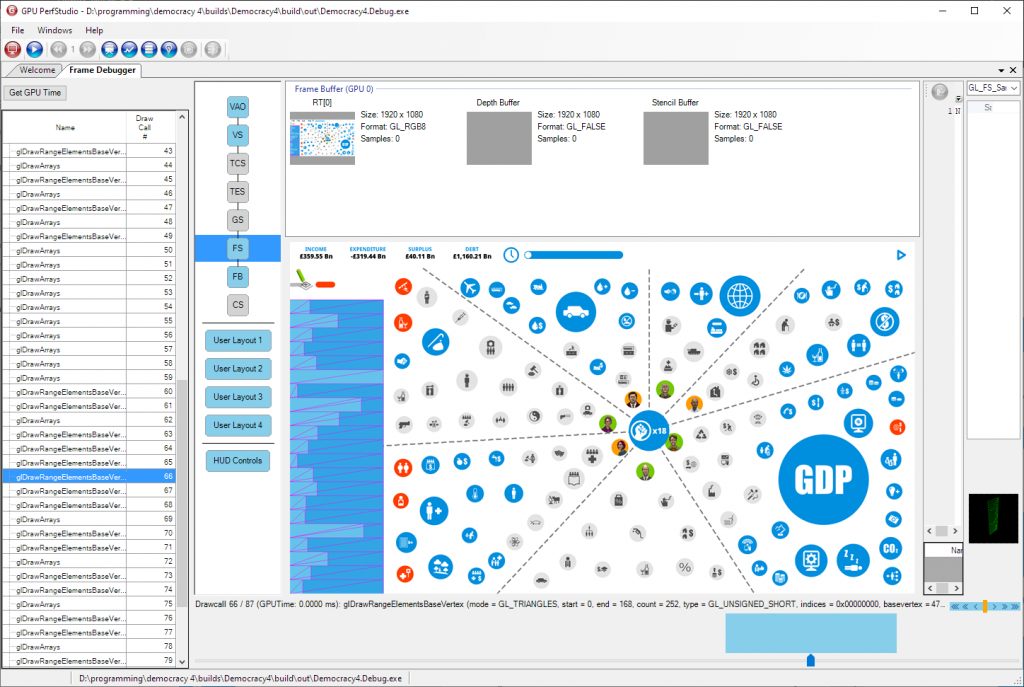
You can see there that I just drew all those blue rectangles on the left of the screen (with a single draw call, for max speed).
Also check out this cool screen, the CPU API Trace, which seems to show you a timeline of all your draw calls and how long each thing took. If you suspect one draw call takes way too long, this may explain why, or at least confirm it…
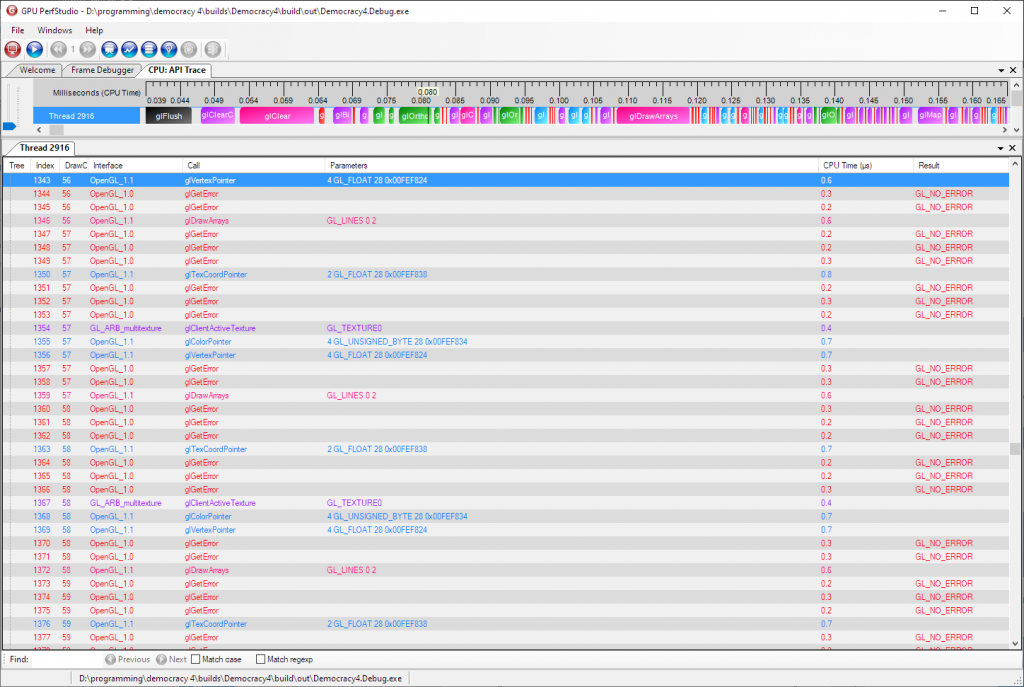
BTW top tip: ctrl+mouse wheel on the top progress bar does fine-tuning of zooming in and out to see each item…
Ultimately, tools like this are a great way of working out when you are doing *really dumb stuff*. I found out yesterday that despite writing super cool code to batch drawing all of the voter strips in 3 or 4 draw calls, I was then rendering each one of them individually in bits again right afterwards due to a bug. I would NEVER notice this any other way, because obviously you cant tell when items have been drawn twice perfectly on top of each other, but it was killing my frame rate.
Anyway, this software is cool, interesting, seems to work, and its free. What else can anybody want?