This was not part of the plan. When I made Gratuitous Space Battles, it was not a deterministic sim. Multiple runs of a battle could lead to slightly different results. It was not ideal. And I was not even thinking about it with Ridiculous Space Battles, until I started to do balance testing and started designing campaign levels. And in that testing I started to really appreciate how infuriating a lack of determinism was. That was more than a week ago. Maybe two weeks…
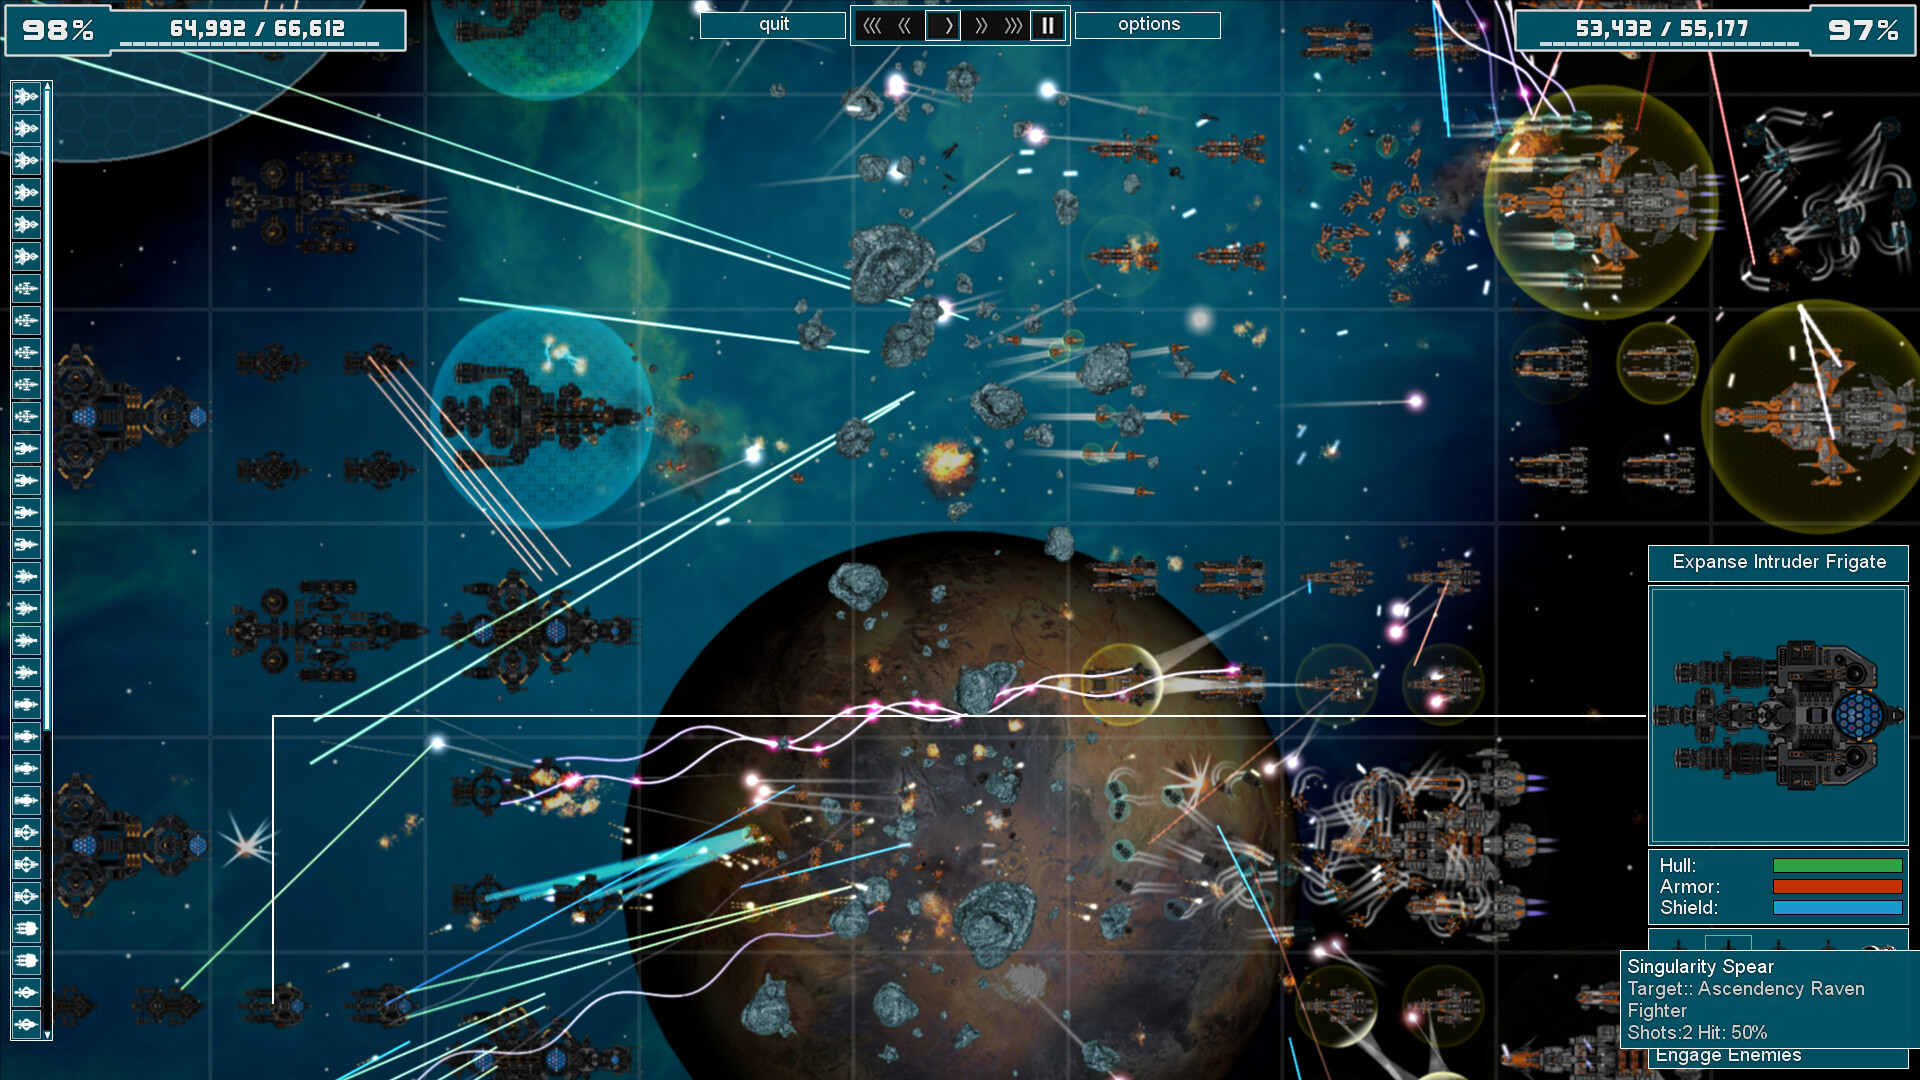
To explain: Ideally if you do two battles in RSB with the exact same deployments, you should get the same result. Not just victory or defeat, but the exact same score. This is is the whole core of the game. The smaller the fleet you win with, the more points you score. So running the whole battle again with just ONE less squadron, is definitely worth it for the meta-game (and bragging rights). But that might mean fielding 99 squads instead of 100. In other words, the game has to be accurate down to that 1%, and actually that means 100% deterministic.
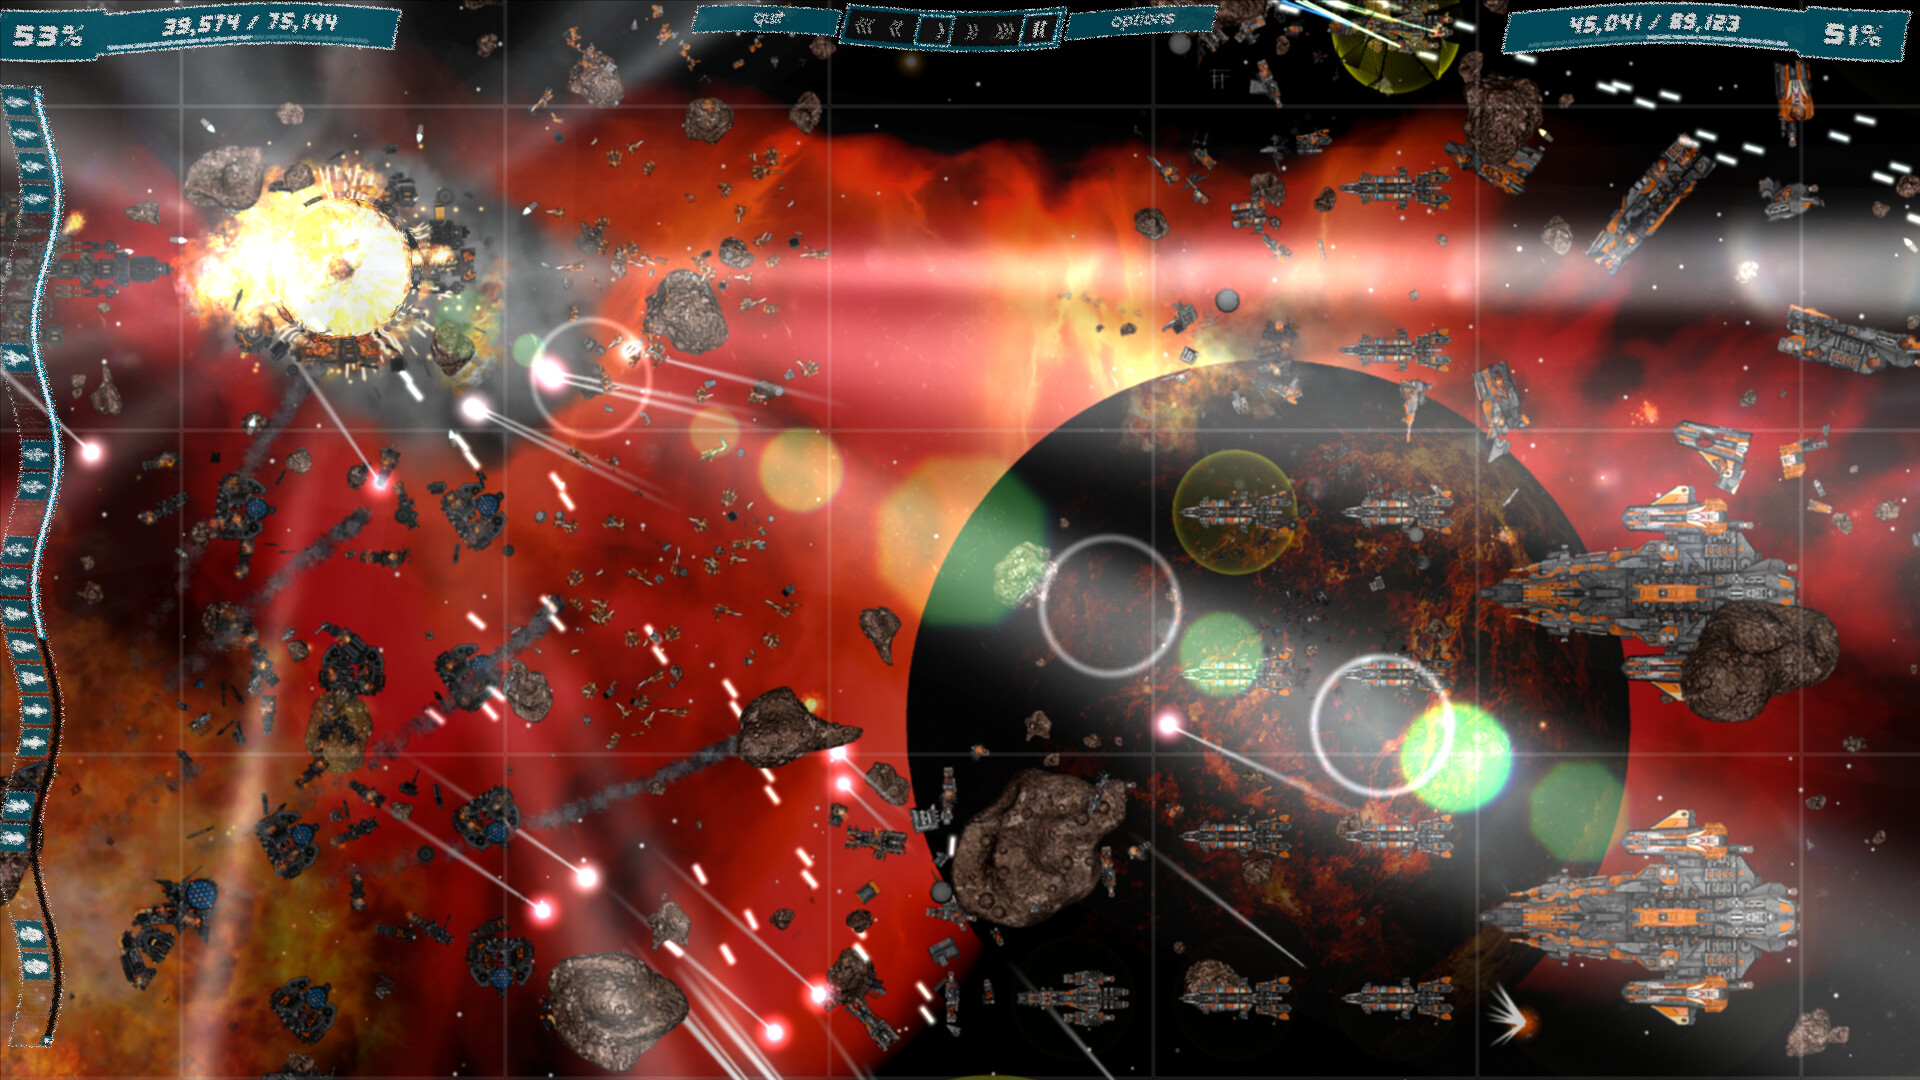
Here is the problem. A missile fired from a frigate drifts 0.0001 units to the left compared to the previous run-through. That means it actually hits its target VERY slightly later, but that ‘later’ means just *after* its target fires its massive mega-gun that takes out a crucial enemy cruiser. Without that cruiser, the fleet will narrowly lose. With it, the fleet will narrowly win. So that missile MUST hit its target in the exact same frame, every time…
…and its worse. That missile might even be a dummy missile. It might even miss! it does not matter. Because in theory that 0.0001 units means its the nearest target for a point defense laser, or not. That could still lead to a chain of events that results in the whole outcome of the battle being changed. In practice, if you want the outcome of a big battle to be predictable, and repeatable you need a 100% deterministic simulation. Thats not 99.99999% deterministic. Its absolutely 100%. And that is… hard.
I’m not a n00b coder. I know this problem is hard, AND I know in theory how to avoid it. Have a constant simulation rate, and detach the frame rate from the sim rate. Do not use any truly random numbers, but precalculated ones based on a fixed random seed. You can use true randoms for UI, but never for the sim. The sim is the sim. The UI is the UI. They never get confused. Simple right? And I am sure coders who haven’t worked on it before already think its an afternoon’s work. It is not!
It would have been WAY easier if I had worried about this right at the start of coding the game, but I did not, and so I had to take a huge existing game and MAKE it deterministic, and its taken weeks and I’m not yet 100% sure I’ve cracked it. I have definitely made it much better, but am I at 99.99999% or 100%? Lots of testing tomorrow will answer that for me. But briefly, this is what was involved:
Step 1 was to move from a variable frame rate (capped at 60 fps) to a dual system where the sim runs at a constant interval, but the frame rate is independent. This is complicated by the fact that the game has 5 speeds, from 1/4 speed to 4x speed. Actually to be fair this part of the work was quick and easy. I still have a ton of macros in the code referring to SIMTIME that actually should now just be ‘4.0f’, but thats the beauty of macros. There was a fair bit of find/replace to change a lot of calls in the code to either use SIMTIME or FRAMETIME, but that was simple. Now every tick assumes 4ms has passed, and the ratio of ticks to frames simply depends on the current game speed. This does mean I have kind of lost the ‘frame-smoothing’ for when the GPU is under more or less strain, but TBH the game runs so fast its ludicrous anyway, and for super low spec GPUs the game has a ton of graphics detail settings.
So that sim/graphics decouple was a big step, and an easy step, but after that the real problems began. Basically there were mistakes somewhere in the code. There were circumstances where things drifted out of synch, and it took a ton of detective work to find them all. Things went much quicker when I realised there was no escaping just writing a big ‘Determinism’ class that analysed data across two runs. I made a ton of mistakes here, and they are stupid, but thats coding for you :D. The most embarrassing one was this: I collected a TON of information for every tick, in huge arrays, and then on the second playthrough, I built a second bunch of arrays and kept cross checking them to spot errors. Sounds reasonable right?
Firstly like a muppet, I was checking for ‘drift’ of values every frame, but storing all this data a second time. Stupid. I only need the PREVIOUS playthrough’s data. I just need to collect *this* frames data, and compare against the past. But thats a ‘current-frame’ snapshot. I don’t need to store that! Secondly I was stupidly searching for a matching tick’s data in the previous playthrough. Madness. I KNOW what tick we are on. I can just index it, and do a super quick compare ffs…
You might think thats stupid worrying about optimisation in pure-debug code…but this is a 32 bit app, so limited to 2GB (or maybe 4GB depending on settings), and although my game stays nicely at about 6-700MB, storing 80,000 frames of simulation data for every ship, missile, drone, mine and bullet very rapidly hits that limit. I needed super comprehensive simulation snapshots, but memory-efficient ones. This proved tricky. You might think ‘store everything’ but trust me, its just NOT an option for a long, large battle with this level of complexity and 240 ticks a second (60fps but possibly 1/4 speed so 240 sim ticks per second).
Oh BTW if you think ‘cliff that’s dumb. At 4x speed you still only need 1 tick, just make it a tick thats 4x as long’. NO. This is because in code, a missile moves every tick. If it hits the target, stuff happens then, and in the following ticks. If you bundle 4 ticks into 1, then the missile ‘hits’, but nothing else, whereas it may hit in tick 1, and then ticks 2,3,4 the affected shield slowly regenerates. In other words my sim is discrete tick based, not variable time equation based. Its just simpler this way :D.
So what other really stupid mistakes took me days to sort out? Well they are all kinda dumb, but in a code-base this big, I think I should cut myself some slack. And actually in TWO of the big cases, in the back of my mind I knew as I coded them that they were flaky as hell. Normally my code is VERY cleanly split between simulation and graphics. In fact all my classes are called SIM_Thing or GUI_Thing, to make that super clear, and make sure I don’t do anything dumb like change the sim from the GUI, which would be really bad software engineering that obviously I shouldn’t do and obviously I did in two places :D.
The first one was a bit obscure. When ships ‘escape’ the battle, they quickly zap off the screen like they are entering hyperspace. To make it seem cool, every ship zaps-away at a slightly different speed, because then it looks like the rebel fleet going into hyperspace in return of the jedi… And thats all well and cool, but it used a proper random number in the GUI code, and at the end of the warp-jump, it then told the SIM the ship had escaped at last… What terrible code. This was the GUI setting times for the SIM. Madness. And a determinism destroying bug. Very rarely that extra 50ms was long enough for an enemy ship to get just one extra enemy-destroying shot off…
The second one is even more obscure. I have classic graphics-distorting shockwaves when big ships explode. They look cool, AND they also move debris, hulks, escapepods and (it turns out) missiles, slightly in space as the ‘wave front’ hits them. I coded this with the GUI determining what SIM objects to move when… because it was way easier. I know in the GUI code the radius of the shockwave, so I can detect anything I need to move in the GUI code, and apply a physics force to them. The trouble is…thats the GUI lecturing the sim again, and because speeds can vary we cannot ensure the sim tick / frame rate ratio, which means in one playthrough a shockwave moves a missile maybe 4ms before another playthrough, and that tiny difference is determinism-destroying. For now, I just stopped missiles reacting to shockwaves. The rest is just UI and doesn’t matter.
So thats where I am now. I have run 6 consecutive tests on 2 different (smallish) levels, and its 100% deterministic. It was HARD. All the mistakes were dumb ones by me, which is basically the definition of coding alone. It took a lot of detective work, and really focusing on the very first deviation from known values to track it all down. (There were many other minor causes). One of the side effects of working so hard on all this is that it really has reminded me how much I love the TV show devs. Which if you have never watched… why the hell not?