My current game: Democracy 4, currently has very good steam current reviews and all reviews scores. As I check right now it sits at 90% positive recent, 85% positive all reviews. However, 90% is not 95%, and any improvements to the game are bound to translate into higher scores, longer play times and better sales, and as balancing the game requires a huge amount of data analysis and thought, and is therefore what I consider fun…lets do some more!
Because it is a ludicrously complicated game, the only possible way to ‘balance’; the game is statistical analysis. There is no way I could hire a team of QA people to give me feedback on where the game is unbalanced, because the number of play styles and strategies, and political opinions, and then the different countries, difficulty settings and other options would mean even if I had 100 people analyzing 20 games a day, its still ludicrously trivial compared to the actual ‘problem space’ that the game represents.
Thankfully, the game sells well, and if I pick yesterday as an example, we clocked up a total of 3,754 games played by players in one day. These are proper paying customers whose stats don’t lie, so analyzing the data from these playthroughs is invaluable. I do not collect ALL possible data (that would strain even my dedicated server, whose current database size is 14 GB), but I do collect some interesting snippets (anonymously).
I rely on my own intuition and feedback in reviews (good and bad) combined with forum posts to give me a feel for areas where the game needs improvement. A topic that seems to come up a lot (with justification) is that the first term of a game is pretty well balanced, but if you ‘survive’ to a second term, things get easier and easier and the game loses its challenge. To check if this was really true, and look at some possible causes, I collected stats by each term and got this:
T1 Wins = 54.19 % T2 Wins = 79.23 % T3 Wins = 83.97 %
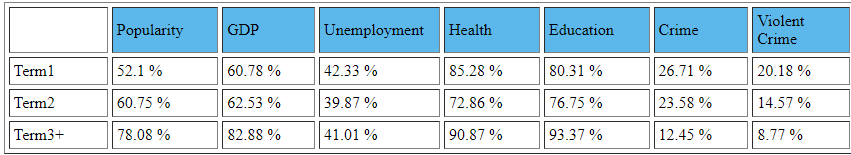
Thats term 1,2 and 3+ win rate for game version 1.45. Its pretty clear that the intuition is correct. The game gets easier the further you go. The big question though is exactly WHY does this happen. In order to collect relevant stats I needed to think about what factors could make governing a country too easy. Maybe GDP gets high and stays there? Crime gets solved for good? Technology gets ahead and stays there? Unemployment solved for good? I collected player stats at the time of each election and plotted them over 1,2 and 3+ terms to get these stats:
and also…
So it seems that the stats do not lie. Multiple things seem to get good and… stay good. Education seems a bit easy to raise after 2nd term, but maybe thats because a booming economy allows for infinite spending on state provision? Sadly I do not have data for that, but its clear that GDP has an inexorable rise. Its also interesting to see that crime steadily declines, especially violent crime.
Stats like these are invaluable. Democracy 4 has a bunch of self-balancing mechanisms that are not artificial game constructs but based on what appear to be real-world auto-balance phenomena. It does seem to be the case that skyrocketing GDP in the real world can drive massive inequality (relative poverty…. even if actual absolute poverty declines). This rise in inequality can give rise to higher rates of crime, and also to political dissatisfaction.
Higher GDP and Technology can be a sign of increased industrial automation, which should really cause big spikes in unemployment, and thus also ineuqlait6y, but these do not seem apparent. Luckily, I have control of every equation in the game, so after reviewing all these stats I could make a bunch of adjustments and hope to see a budge in the direction of a more balanced (ie: more challenging) late game. Lets look at the new stats for build 1.46:
T1 Wins = 54.54 % T2 Wins = 76.46 % T3 Wins = 83.06 %
Ok… so slightly better T2 (a bit harder…. 76% win vs 79%) and very marginal improvement from term3 and beyond. How did my actual core stats change:
If anything WORSE for GDP, although I did make unemployment worse, and a slight term 2 boost to crime, but fairly trivial. second row:
Ok… so equality IS now harder to raise in later terms, which is a slight improvement, but basically I have been way too meek in my adjustments and need to ramp those changes up. I also started tracking some additional stats:
This is new data for build 1.46 without prior data to compare to, but I felt it important to start measuring. Winning is the value of a special hidden variable I use in the game to adjust difficulty. That percentage DOES go up over time, which makes sense, although its clearly not hitting the upper 90s, so I could simply take into account consecutive election wins as some input into calculating its value?
Turnout is more of a curiosity, but vote percentage is much more interesting. In the *ideal* game of Democracy 4, the player scrapes narrowly through on each election, excited to view the results, and relieved to know they won another turn. 52 and 58% feel about right, but averaging 74$% is pretty worrying. Perhaps cynicism is not a strong enough effect here, especially given that it clearly drops between terms 2 and 3! (in the real world show me a president who people did actually become less cynical about over time…).
So the main thing is that I have useful stats and a system to compare them and check I am heading in the right direction. The game clearly got a bit more balanced between games 1.45 and 1.46, so here is hoping that being able to spend more time post-release on balancing versus features will allow me to improve that even more…