How long does your indie game take to start up? from clicking the icon to actually being able to take input at the main menu? Just for fun, I decided to analyze whats involved in doing so for mine.
Because the aim here is to actually analyze the REAL impact, not the best case, I need to ensure that the game (Production Line) is not just happily sat there all in RAM from a recent run-through, so it seems best to oh…maybe launch battlefield V beforehand (and quit it) just to populate disk/RAM with a load of other stuff and do my best to evict all my games code.
Then…its time to fire-up aqtime and take a look. I decided to do line-level, rather than just function-level analysis, which slows the game massively, taking 17 seconds to start (the reality is dramatically faster), but I can still do relative comparisons.
First thing to notice is that pretty much the entire time is inside Game::InitApp() which makes sense.
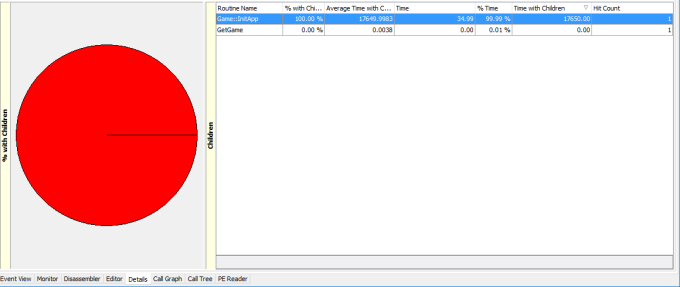
Rather worryingly though, the vast majority appears to be inside SIM_Threadmanager::Initialise. That *may* be an artifact of aqtimes approach to thread profiling, but worth taking a look inside anyway… And it turns out that 100% of that time is inside SetThreadName() (which i only need for debugging anyway). This is a rare bit of code that I don’t understand well, and was from the evil interwebs:
#pragma pack(push,8)
typedef struct tagTHREADNAME_INFO
{
	DWORD dwType; // Must be 0x1000.
	LPCSTR szName; // Pointer to name (in user addr space).
	DWORD dwThreadID; // Thread ID (-1=caller thread).
	DWORD dwFlags; // Reserved for future use, must be zero.
} THREADNAME_INFO;
#pragma pack(pop)

void SetThreadName(DWORD dwThreadID, char* threadName)
{
	THREADNAME_INFO info;
	info.dwType = 0x1000;
	info.szName = threadName;
	info.dwThreadID = dwThreadID;
	info.dwFlags = 0;

	__try
	{
		RaiseException(MS_VC_EXCEPTION, 0, sizeof(info) / sizeof(ULONG_PTR),
(ULONG_PTR*)&info);
	}
	__except (EXCEPTION_EXECUTE_HANDLER)
	{
		volatile int foo = 9;
	}
}
The exception is basically ALL of the time. WTF? Apparently there is a less hacky way outlined here: https://docs.microsoft.com/en-us/visualstudio/debugger/how-to-set-a-thread-name-in-native-code?view=vs-2019 Which I will try later. I suspect the waiting for visual studios debugger is the cause of the problem.
Anyway…onwards and upwards, so whats next? It basically all Init3D() (click to enlarge)
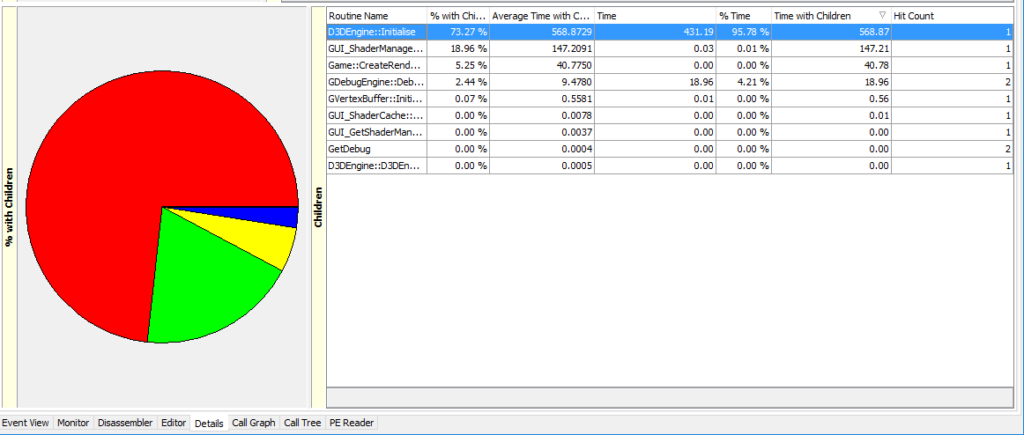
So basically my DirectX initialisation and the shadermanager stuff is most of the problem. I suspect the DirectX initialisdation may be too black-boxed for me to influence further. The first big chunk is this line:
PD3D9 = Direct3DCreate9(D3D_SDK_VERSION);
Which takes up 34.74% of the start time. The next slow bit is the largest at 41% which is:
hr = PD3D9->CreateDevice( AdapterToUse, DeviceType, WindowHandle,
 D3DCREATE_SOFTWARE_VERTEXPROCESSING, &PresentParameters, &PDevice);
So…holy crap. how can that line of code even be run? This can only happen if my checkcaps() code suggest the video card does not support hardware transform and lighting. I suspect some of the reporting here must be nonsense? Especially as my own debug logs suggest that the hardware TNL version is the one than ran… FFS :( lets look outside that code then…
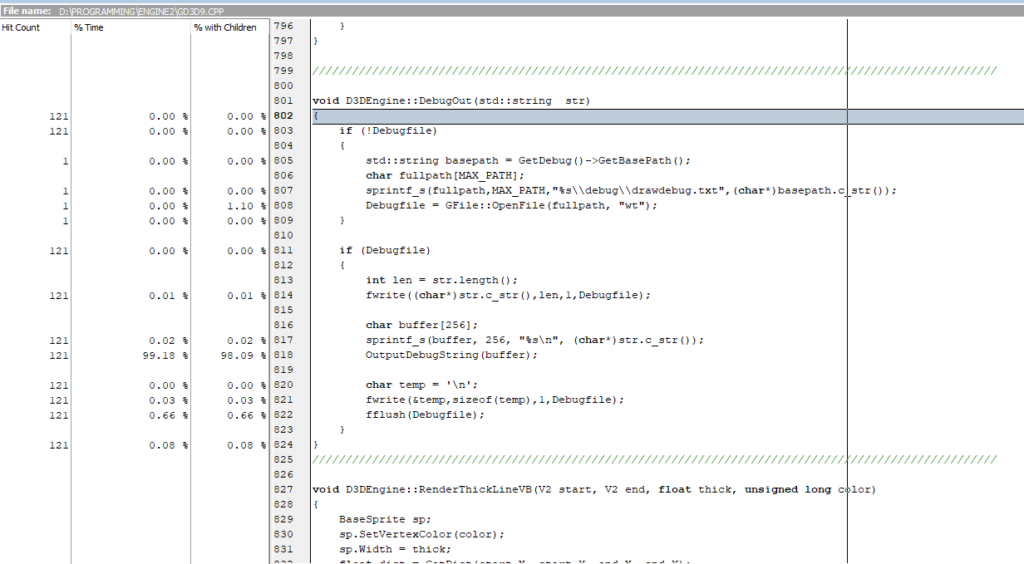
Most of the slowdown is in shader manager, which loads 11 shaders:
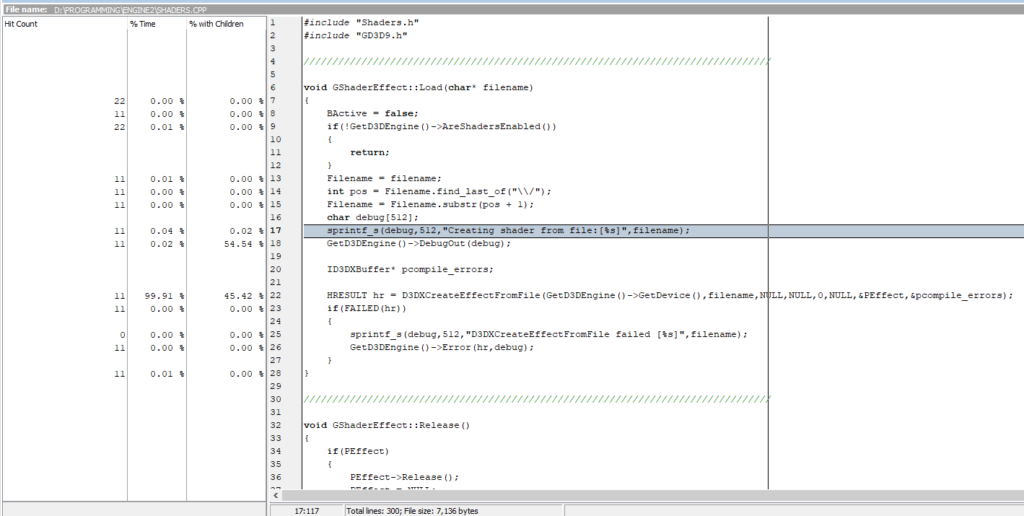
so it looks like about half the loading time here is actually spent writing out debug data! This is hard to avoid though, as I do find this data invaluable for detecting errors. And because an app can crash and lose all its data, I flush each line of my debug logs to disk with a hard drive flush on each line…
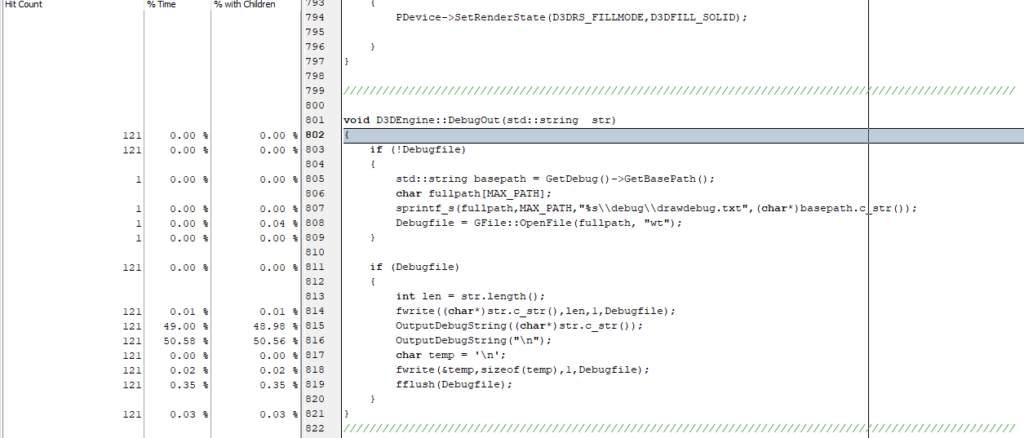
…so interestingly all the time seems to be inside OutputDebugString, which is only of any real use when the debugger is running. However! I *do* want to see that data in both release builds, and debug builds. Maybe I need a flag to tell if a debugger is present when the debug engine starts up? As a first pass I should at least build up a char* with the newline in to avoid twice the OutputDebugString calls. Here is the new code and timings.
Ooooh. I’ve halved the time of it. I’ve done the same with my non-directx debug code too. Now I’ll try changing that thread stuff… It turns out that SetThreadDescription is windows 10 only, so I need a different system (and apparently would need to update my platform SDK…urrrgh), so maybe best to just skip calling that code when no debugger is detected?
This works (using isDebuggerPresent) but the profiler actually trips that flag too, so to set it work I needed to compare time stamps on debug files. Without the debugger, it looks like time from app start to menu ready is 0.395 seconds. With the debugger its… 0.532 seconds.
That sounds pretty small, but actually I’m quite happy as I lost ZERO functionality, and the changes to the debug data will affect any time that data is written, not just during startup. 9Its not a lot, but there is *some*, and I’m an efficiency obsessive.
I think I’ll put a clause around the debugengines OutputDebugString and nuke that unless IsDebuggerPresent() too :D