I’m still working away on improving the balance for my political strategy game ‘Democracy 4‘ which is in Early Access, and likely the hardest game to balance in the history of humankind, due to the insane number of interconnecting variables.
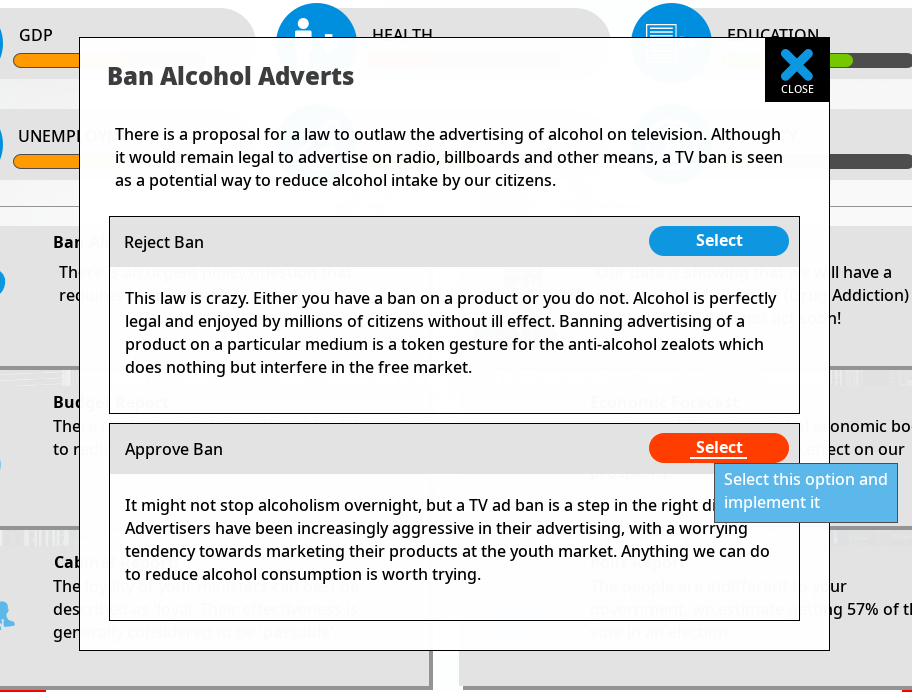
Something I was working on today was the likelihood of each dilemma popping up. These are occasional ‘situations’ that are urgent and need the player to make a choice one way or the other. Basically the choices are always hard, because they mean upsetting someone, or causing an effect that may be undesirable given your goals.
For example, if a company is about to collapse, you could bail it out (pleasing the workers, but setting a bad example for other companies, maybe upsetting capitalists, who prefer a free market), or not, and your decision depends on who you can afford to (or choose to) upset at that moment.
Some of the dilemmas are totally random, but most are influenced by some variables so that they seem fairly ‘relevant’ to the way you are playing the game. So they all have inputs based on certain variables, and thus as the game designer I don’t know in advance when they will happen (they are not timed or scripted in a conventional way).
This is all very easy to design and code, but the problem is you can end up with the inputs being unbalanced, and thus maybe everybody is sick of seeing dilemma A, regardless what they do or how they play, whereas interesting and exciting dilemma B hardly ever gets triggered. For a small studio with a limited budget, having any game content that is rarely seen by the player is an efficiency disaster.
Luckily I (anonymously) keep track of every trigger of a dilemma by version number, so I can guild up big databases of such events. The events database is currently about 4GB in size, and is testing the limits of my MySQL optimization abilities. Thus I copy the last 2 versions events into a much smaller (600MB) database for me to query. That lets me get cool charts like this:
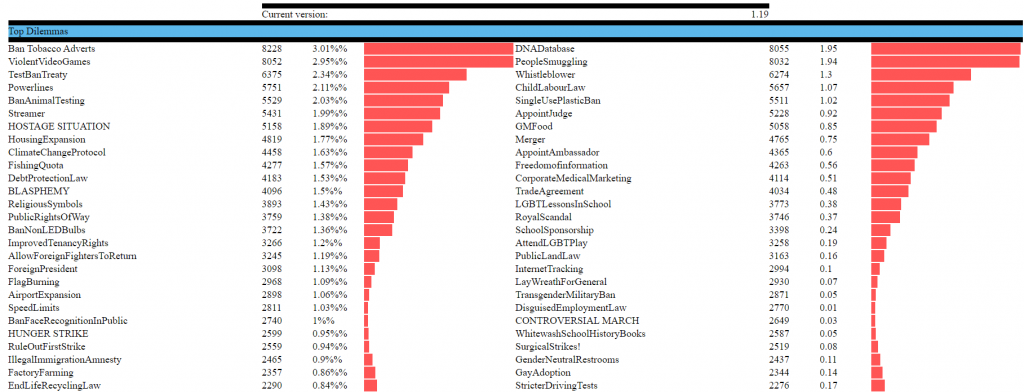
Which lets me visualize the extent to which some dilemmas (the ones with long red bars) are triggering WAY more than they would if their distribution was completely random. I’ve been using this data for the last few versions, but I still have the unbalanced issue despite a lot of manual revisions, so I’m working on code today to visualize this better.
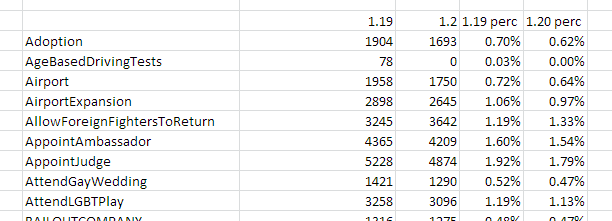
I actually found this easier in excel, once I had data that showed me every dilemma, and what percentage of dilemmas each one represented, over the previous 2 versions:
I can then work out what percentage they *should* be, thus the error in terms of over or under representation. Luckily I’m analyzing 100 dilemmas, so its a simple 1%. I calculate an error in percentage terms, for each version, then calculate the change. A positive value is movement towards better balance, a negative one is movement away, (worsening the balance). This can then be conditionally formatted in excel:
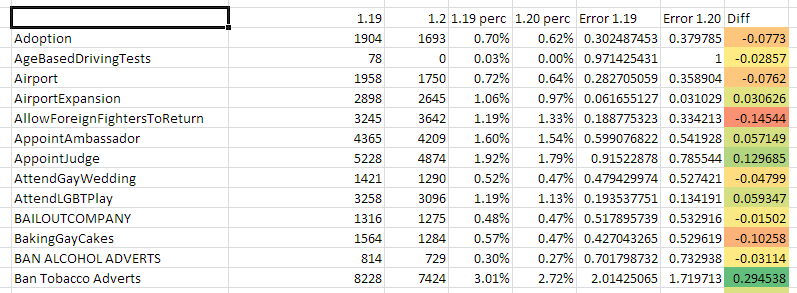
Which is a cool trick, but also depressing to see the extent to which I often am having a trivial effect towards balance, or even making things worse (negatives).
However, at least having a nice process to visualize this stuff makes it more obvious to spot where I am being too timid in my corrections. In an ideal world, this would all be integrated into a single web query, and in an ideal, ideal world, some sort of cool machine-learning AI would be making these adjustments instead of me…
But hey, its a big step up from just ‘setting some numbers and then playing it a lot before release’ which is what I did ten years ago :D I’ll gradually get this stuff more and more optimized.